Blog · What the machine sees
From plate to histogram
The mean length sums up the seed lot in one number. The histogram shows its shape, including the seeds the mean hides.
October 23, 2026 · 6 min read · by Enrico S. Ambrosio
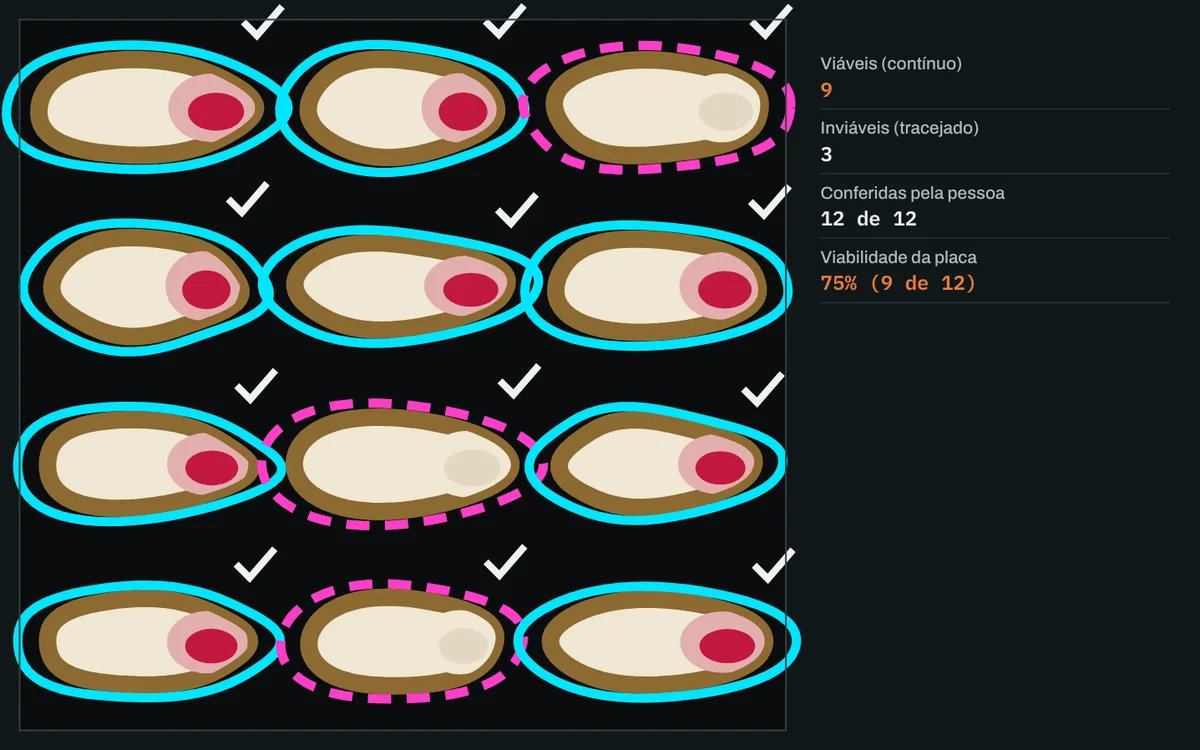
After counting comes the next question. What are these seeds like? The quickest way to answer is the mean. In the simulated plate above, the 50 model seeds have a mean length of 5.19 mm.
The mean is useful, but it squeezes 50 measurements into a single number. The animation goes the other way. Each seed leaves the plate, rotates until it lies flat and goes to the column for its size.
Peas, pins and a new word
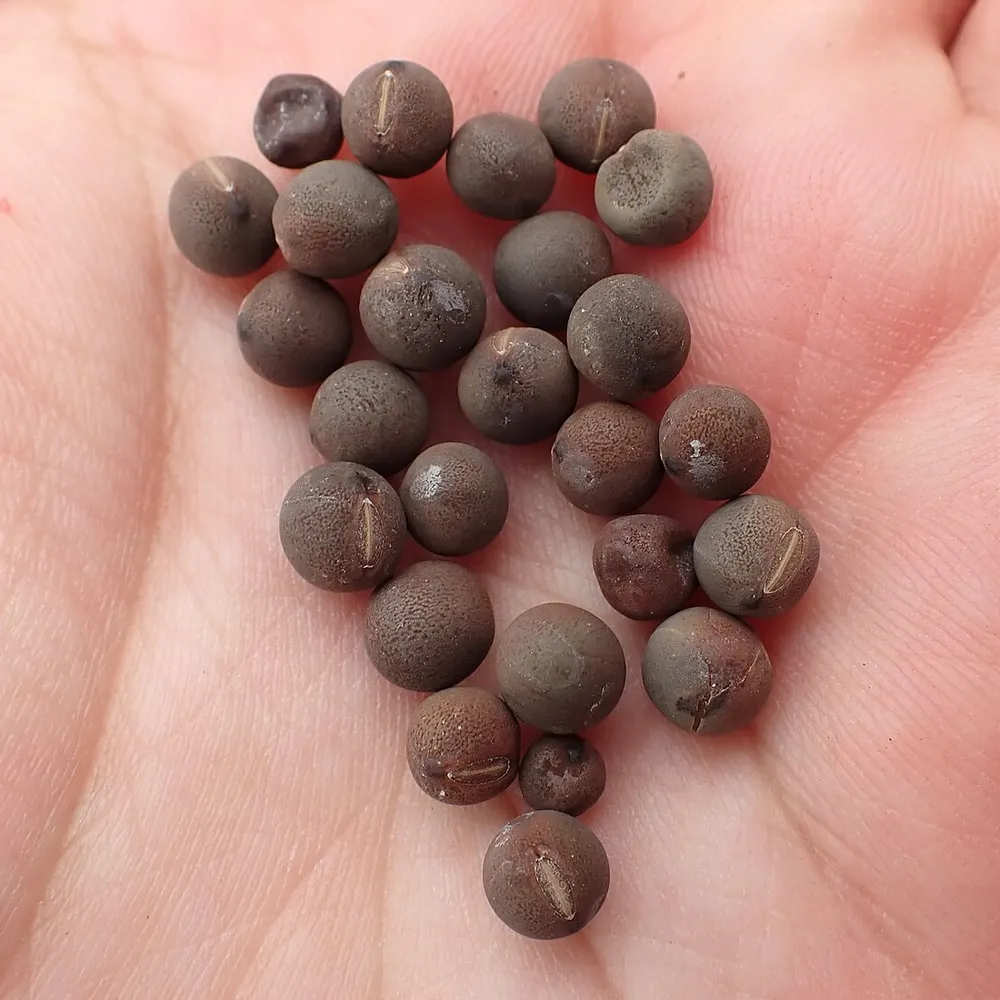
Putting seeds into columns is an old idea, and it started with real seeds. In 1875, Francis Galton sent packets of sweet pea seeds (Lathyrus odoratus) to seven friends to plant. Inside each packet the seeds had the same weight, and the weight changed from one packet to the next. The friends sent back the harvested seeds, and Galton weighed the next generation.
The daughters of the heaviest seeds came out, on average, lighter than their mothers. The daughters of the lightest came out heavier. Both ends moved back toward the middle. In 1877, in a lecture, Galton showed this result with the first regression line.
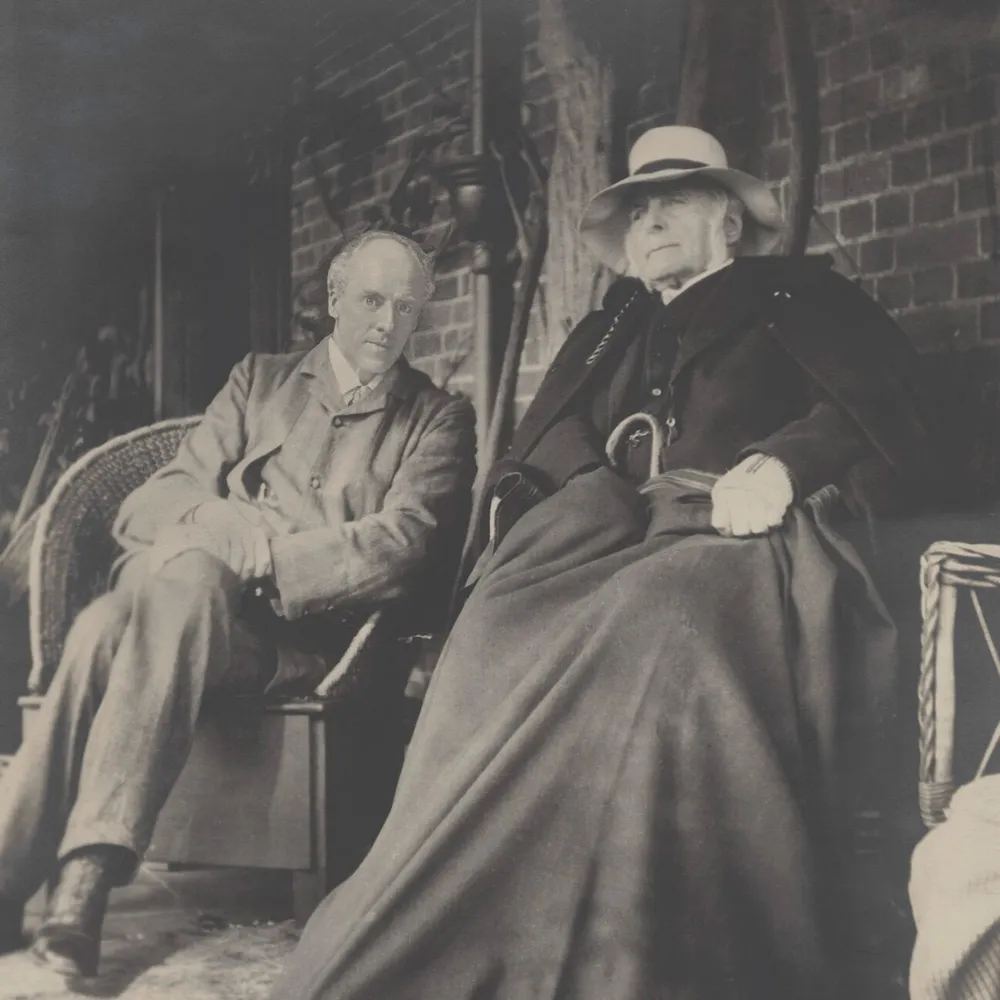
To show why so many measurements gather in the middle, Galton built a box with rows of pins in 1874. Small balls fall from a funnel, hit the pins, bounce to one side or the other and pile up in channels at the bottom. The pile takes the shape of a bell. The device became known as the Galton board.
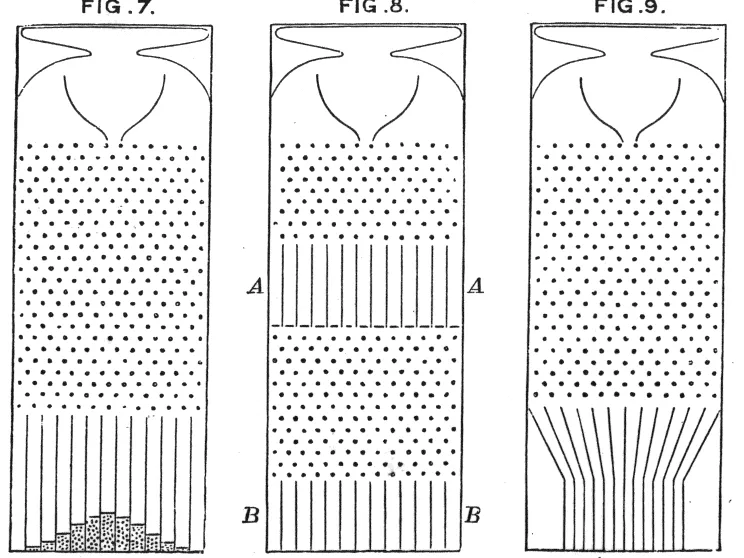
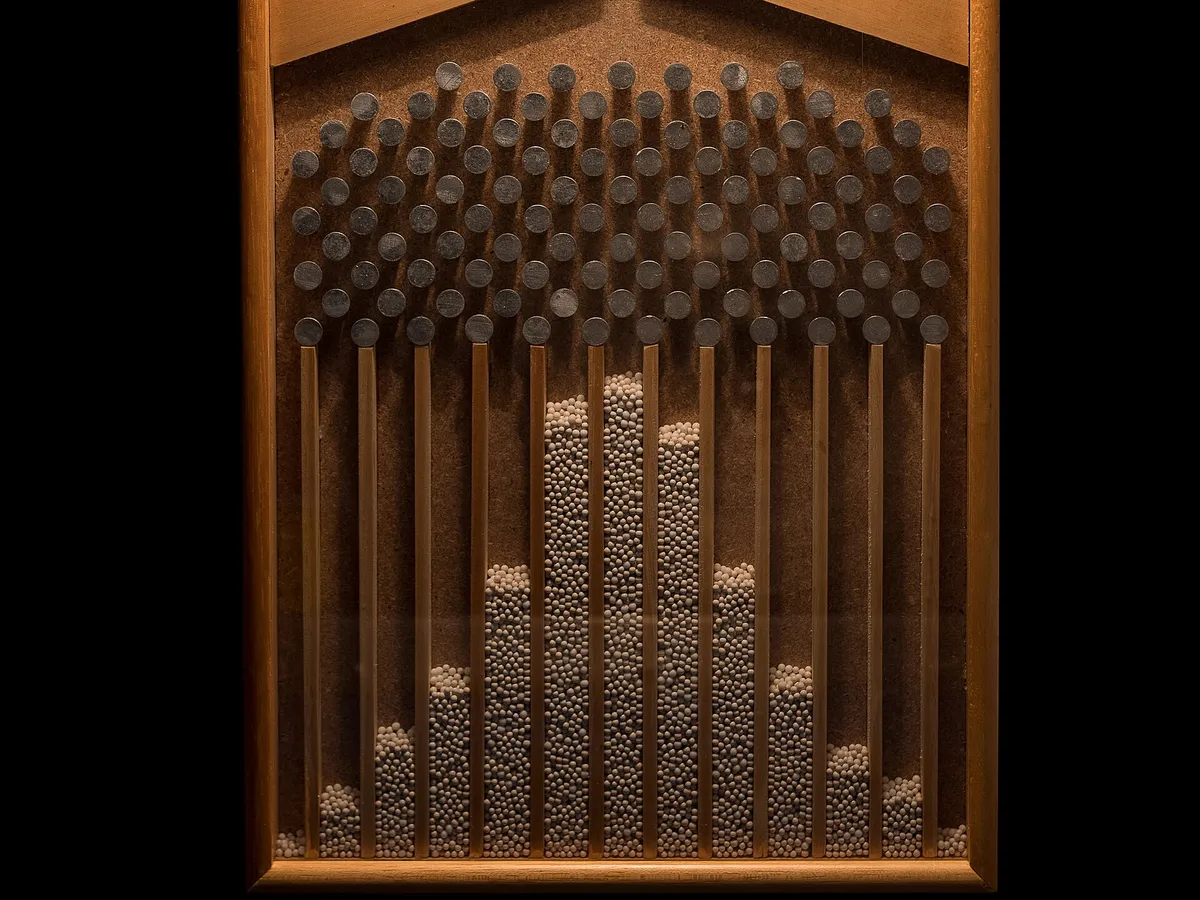
The name came later. Karl Pearson, Galton's younger colleague and biographer, used the word histogram in lectures he gave in London in 1892. He took it from the Greek histós, a mast, after the upright bars. The chart itself was already old, as Pearson himself noted in 1895.
What the mean and the deviation say
In the simulation, the smallest seed is 4.80 mm and the largest is 5.62 mm. The standard deviation is 0.24 mm, or 4.7% of the mean. For a seed lot, that indicates seeds of similar length.
Mean and standard deviation describe a seed lot well when its histogram looks like a bell, with most seeds in the middle and a few at the ends. When the lot departs from that, the two numbers lose part of the story. Two lots with the same mean and the same deviation can have very different shapes.
What the histogram shows
The 50 seeds become 8 columns, from 4.8 to 5.7 mm. The tallest column is the one with the smallest seeds, with 10 of the 50. The column with the mean has 8 seeds, and right next to it there is one with only 3. None of this shows up in the number 5.19 mm.
At the bench, the histogram helps you find what the mean hides.
- A mixed seed lot can show up with two peaks.
- Broken seeds counted as whole ones form an isolated column at the small end.
- A seed lot that has been sieved can have one side of its histogram cut off straight.
160 real faba beans
The plate at the top is simulated. To see the histogram of a real seed lot, we gathered 160 faba beans (Vicia faba) from 16 lines, photographed over a ruler by Ortega Polo and Larkan (2026, AAFC, CC BY 4.0) and measured by SeedCounter. Length runs from 7.1 to 21.6 mm. The mean is 13.1 mm and the standard deviation 3.1 mm, or 24% of the mean. It is a far more varied lot than the one on the plate.
The same 160 measurements become four histograms. With 4 mm columns there is a single bell, and the lot looks like one lot. With 2 mm and 1 mm, a shoulder appears on the small side, between 8 and 11 mm. With 0.5 mm, the picture turns into teeth and gaps, because many columns hold only one or two beans.
The colors tell the rest. Five of the 16 lines have small beans, with a mean of 9.6 mm. That is 50 beans. The other 110 have a mean of 14.6 mm. The lot is a mixture, and even so the histogram does not show two clean peaks, only the shoulder, because the two groups overlap between 9 and 12 mm. At the bench, a shoulder like that is already a reason to split the seeds by origin and measure again.
Where the histogram misleads
We also have to show the limit. Each column in the simulation is 0.11 mm wide. At 40 px/mm, that is 4.5 pixels. A 2-pixel error at the edge of a seed can already change its column. With few seeds, the shape of the histogram also changes with the column width you choose. The faba beans show it, with the same lot going from bell to teeth just by the width. Sturges's rule, from 1926, suggests about 8 columns for 160 seeds. It also pays to look at half and at double the width, and distrusting anything that shows up in only one of them.
That is why the number on each seed matters. If a column looks odd, you can open its seeds and check the outlines one by one. In the app, it looks like this.
This animation started as an idea and became a SeedCounter feature, the gallery that sorts the seeds in the lot by size. In the gallery, the Outside the mean filter separates the seeds that stray furthest from the rest. Open SeedCounter and see the distribution of your lot.
Going deeper: the Otsu threshold, which is also born from a histogram, and the site's image datasets, including the faba bean from Ortega Polo and Larkan.
Sources
- Histogram, with the origin of the term in Karl Pearson's lectures (1892) and Sturges's rule (1926). Wikipedia
- Galton board, with the 1874 board and the drawing in Natural Inheritance (1889). Wikipedia
- Stanton, J. M. (2001). Galton, Pearson, and the peas: a brief history of linear regression for statistics instructors. Journal of Statistics Education, 9(3). Full text
- The 160 faba bean measurements, with the line and the scale of each photo, are in fava-16-fotos.csv. Photos by Ortega Polo and Larkan (2026), AAFC, CC BY 4.0.
For the full math: Shape, with the length and mean shape of real seeds by class.