hilum

Examples

Real seeds, step by step.

Each example shows a real sample: the image, every step in SeedCounter, and the final result. The ones that already have real data are right below. The others are being photographed on the bench and will be added here as they are ready. The demos that ship inside the app, with synthetic images, are at the end of the page.

With real data

Measured on real seeds

Published data and public datasets, processed with the same calculations as SeedCounter. The source and license of each dataset are on Data and credits.

Morphometry · checked against the literature

Rice: 7 of 11 measurements match the published ones

On 1,904 rice grains, SeedCounter computed the same shape descriptors as a published dataset (Koklu et al.). Seven matched with an error of 0.00%. The remaining differences come from calculation conventions, and they are explained.

  1. Area, perimeter, major and minor axes, eccentricity, solidity and circularity.
  2. The shapes separate in shape space, with no one saying which is which.

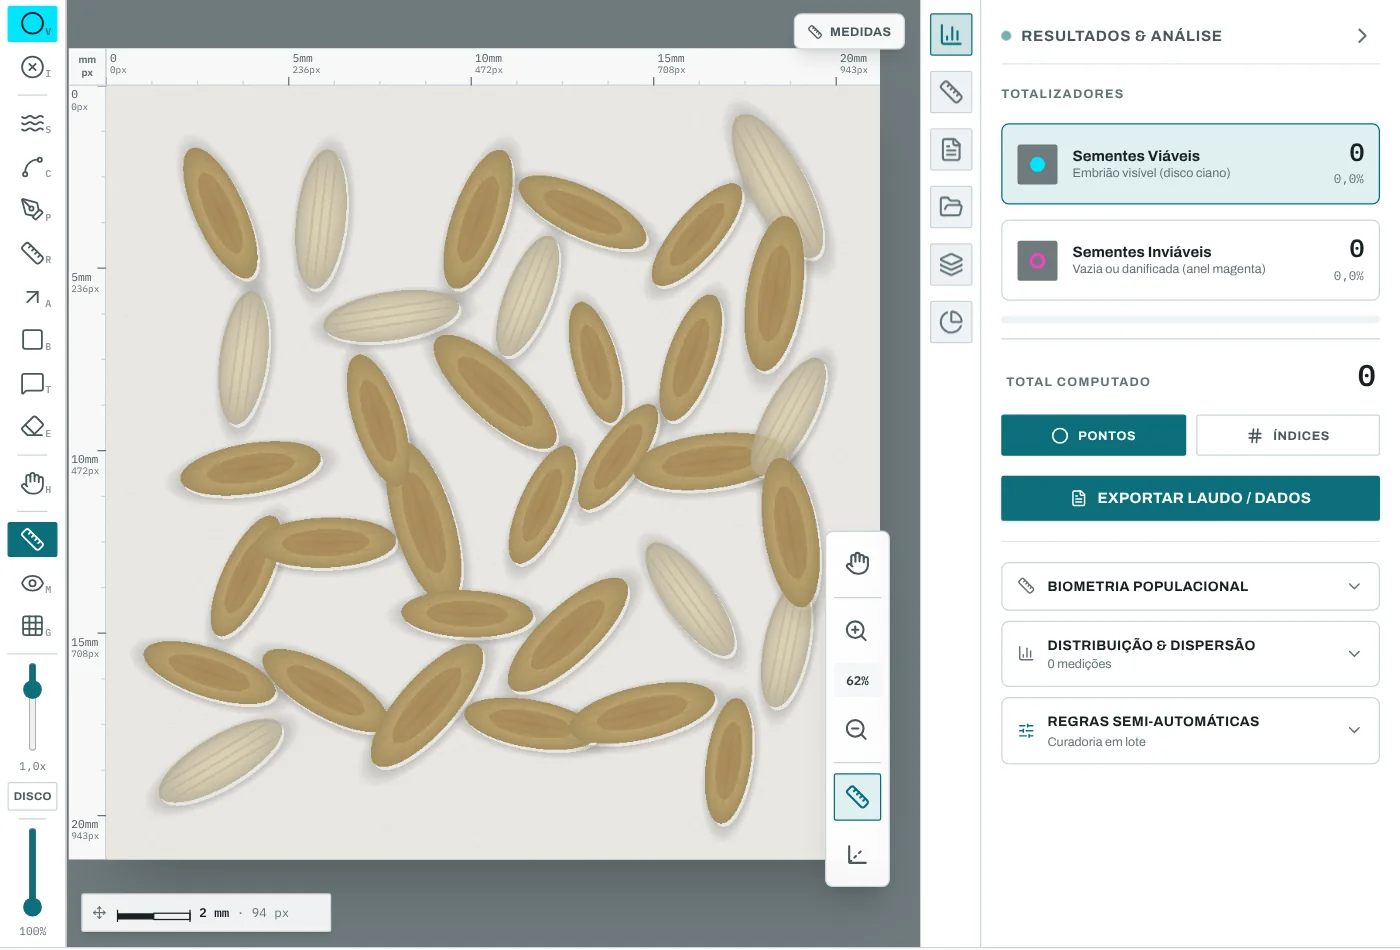
In preparation: two types of rice photographed with a ruler on the bench, from the click to shape space.
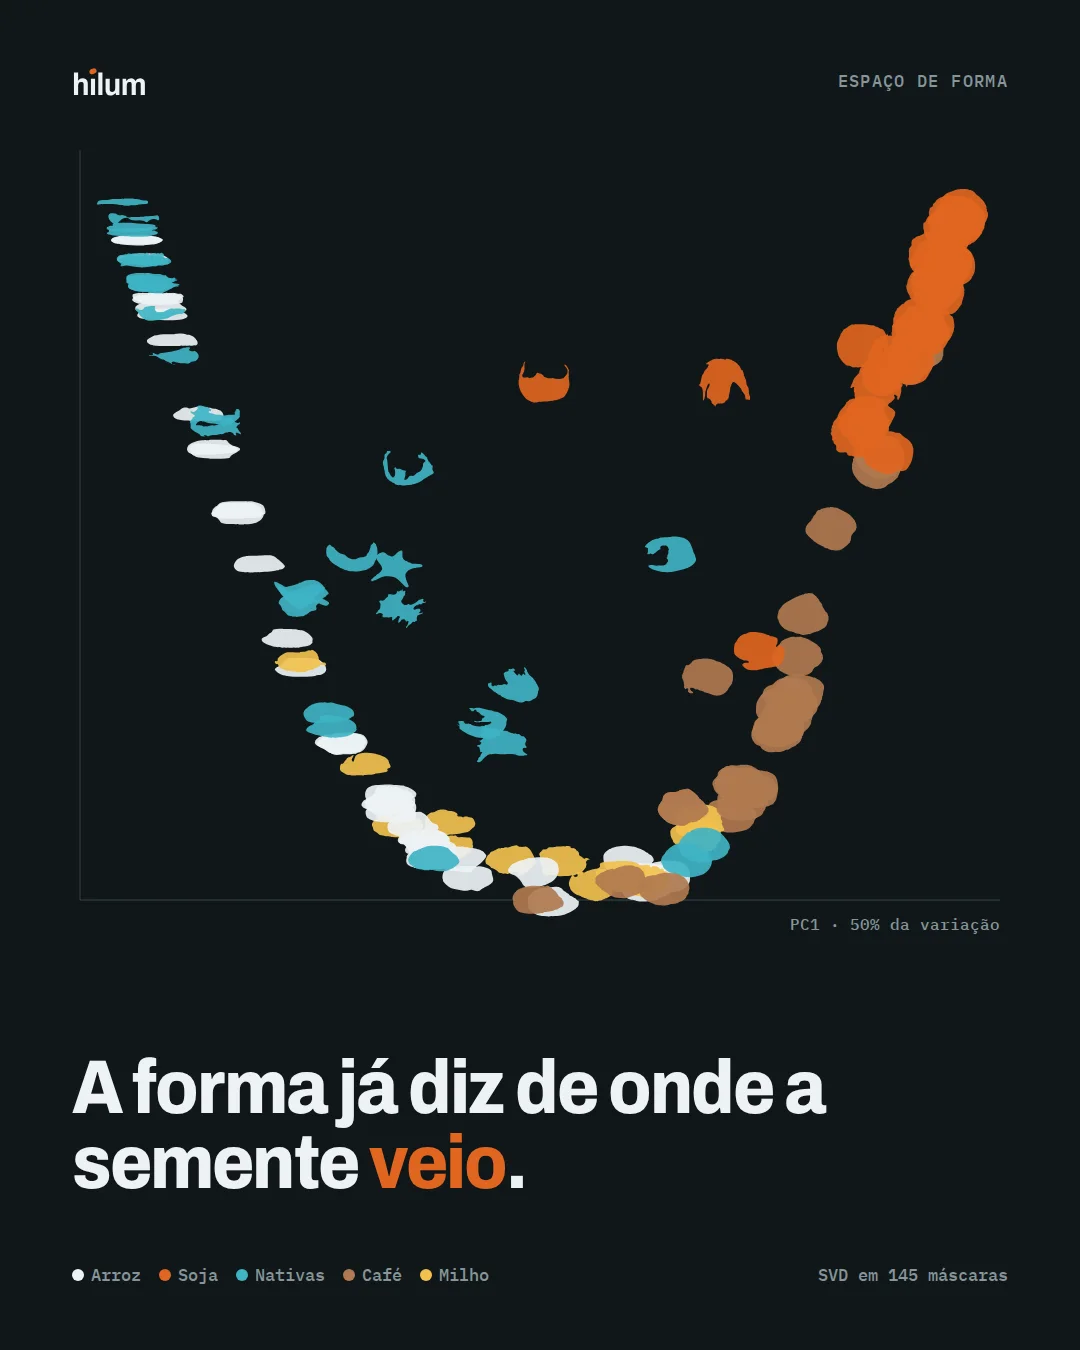
Seed silhouettes spread across the first two principal components, grouped by crop.
Real data145 silhouettes from the public examples in shape space

Quality classes · public dataset

Soybean: what is each seed?

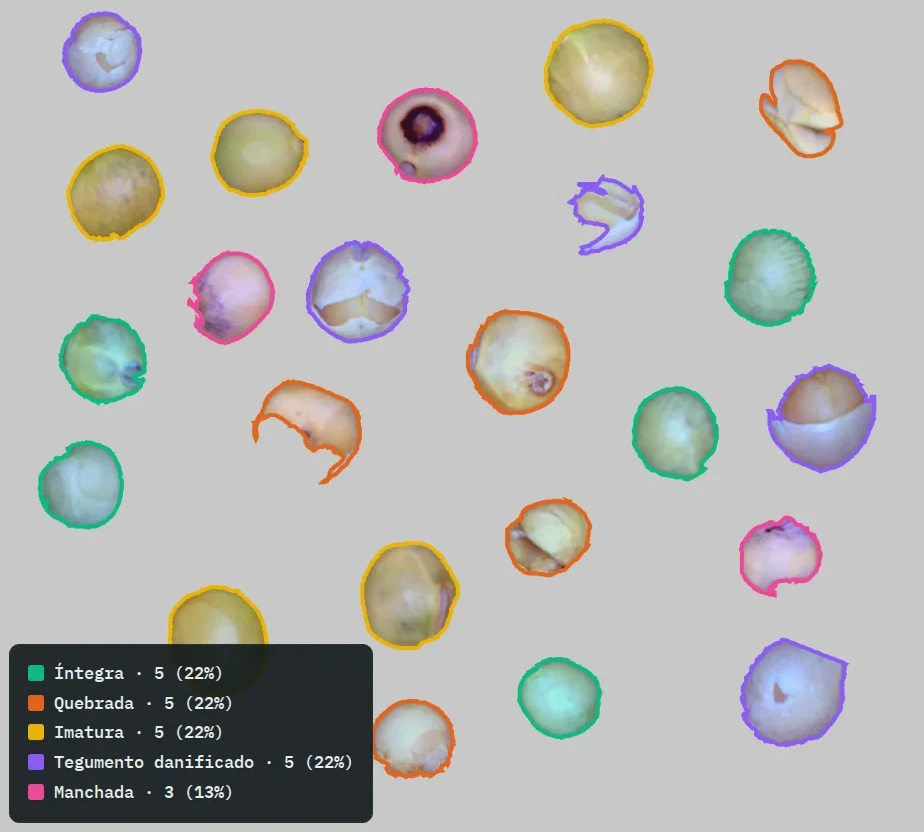
Intact, broken, immature, with a damaged seed coat, or spotted. Counting is the first step; the question for anyone buying seed is how much of the seed lot falls in each class. The colors in the figure come from the annotation of the source dataset.

  1. Load the image of the seed lot with the ruler.
  2. Create the classes for your protocol, each with a color and a marker shape.
  3. Outline each seed and assign its class, checking in the gallery.
  4. Export the count by class with percentages.
23 seeds5 classesOur own sample coming soon · E07
Soybean scene with 23 seeds outlined and colored by quality class, with the legend of the five classes.
Real dataoutlines from the annotation of the source dataset

Counting · multiple crops

Rice, corn and coffee on the same sheet

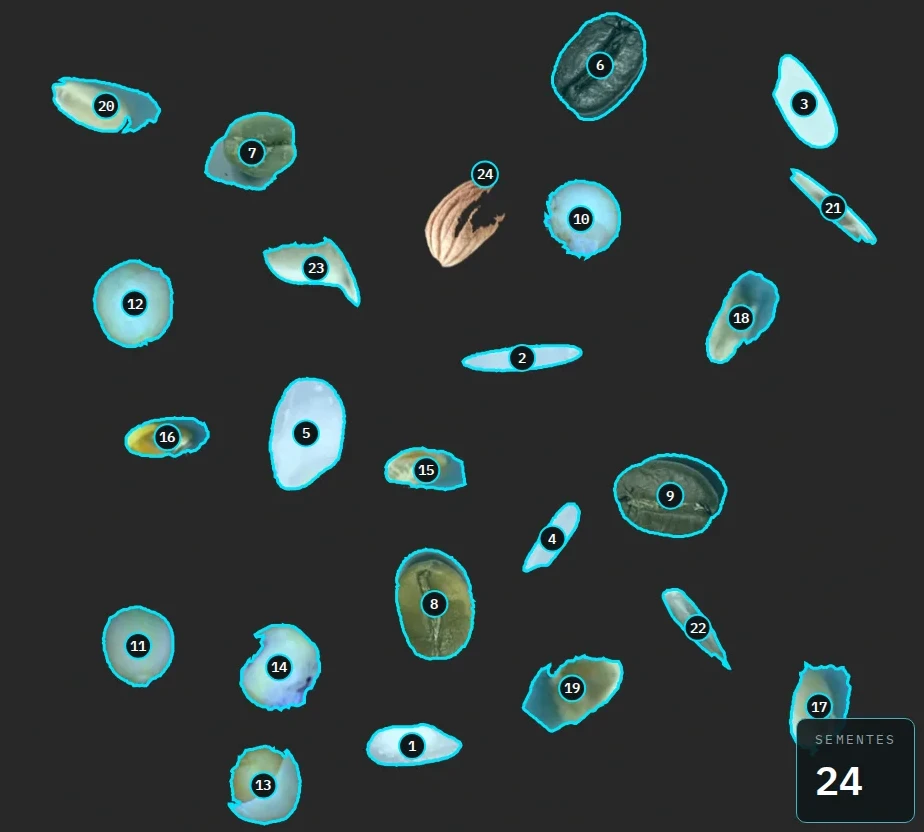
Different shapes, colors and sizes in the same image. Each seed found gets a number, and the total count sits in the corner, ready to check.

  1. Load the image and calibrate the scale.
  2. Outline the seeds yourself or let the optional AI suggest them.
  3. Show the indices to number each seed on screen.
  4. To project it in class, open presentation mode, with a clean interface and the marks on the image.
24 seeds5 cropsOur own plate coming soon · E08
Sheet with 24 seeds of different crops, each outlined and numbered.
Real datascene assembled from public datasets

Morphometry · gallery and dataset hub · version 4.0

Seed size across the lot, one seed at a time

After outlining, the gallery stacks the cropped seeds by length bin, with the ruler underneath. The mean is shown, but the picture reveals what the mean hides: whether the seed lot is uniform, whether it has two populations, whether some seeds are atypical.

In the dataset hub, the same histogram comes from a whole dataset: each polygon in the labels becomes a cropped seed, carrying the label's class. In the screen recording, 20 tetrazolium photos of orchid seeds become 917 seeds, and the hub steps through its five views: the histogram by class, the overlaid densities, the mosaic lined up by the chosen measurement, the mean shape with the shape space, and the color in a* × b*, where the viable seeds separate out by their tetrazolium red. In length, the viable seeds come out longer than the non-viable ones (135 vs. 100 px on average). Part of that is zoom: without a ruler, the pixel measures the seed and the framing together, and within a single crop the difference drops to about 5% (the calculation is in Shape).

  1. Outline the seeds on the plate.
  2. Open the gallery and turn on Histogram.
  3. Change the measurement (length, width, area) and the number of bins.
  4. Use the Outside the mean filter to review the seeds in the tails.
  5. For a whole dataset, open the hub, draw a random sample per class and build the histogram; then switch the view.
Real recordingversion 4.0, light theme: 20 photos from the public dataset Sementes de Orquídeas (CC BY 4.0), 917 seeds; histogram, density, mosaic, shape and a* × b* color

Counting and measuring · dataset hub · public dataset

Soybean pods, one by one

Soybean plants pulled up and laid on black cloth, from a public dataset built for counting pods. The dataset labels give one box per pod; the outlines were generated automatically inside each box and go into the hub as polygons. From 8 randomly drawn photos, the hub crops 392 pods and shows the length distribution, the pods lined up by the chosen measurement and the mean shape.

  1. Open the dataset's folder in the dataset explorer and choose Hub.
  2. Pick photos at random and build the histogram.
  3. Switch to Density, Mosaic and Shape.
  4. Check the pods at the ends in the Mosaic: that is where the bad outlines show up.
392 pods8 photosin px, no ruler
Real recordingversion 4.0, light theme: 8 photos from the YOLO POD dataset (Xiang et al. 2023, Plant Methods, CC BY 4.0), automatic outlines generated from the boxes

Morphometry · dataset hub · public dataset

Three soybean cultivars side by side

Soybean seeds of the cultivars Anjasmoro, Dega 1 and Grobogan, scanned and cropped one by one by researchers in Indonesia, with each seed's mask in the file itself. There are 40 seeds of each cultivar, one row per cultivar in the histogram. The scans in the dataset range from 800 to 950 dpi, so the size difference in pixels between cultivars only turns into millimeters after calibration.

  1. Open the dataset in the hub and build the histogram with the 120 seeds.
  2. Compare the cultivars in the overlaid densities.
  3. In the Shape view, look at each cultivar's mean seed shape: almost the same ellipse.
  4. In the Mosaic, the seeds line up in order of length, from smallest to largest.
120 seeds3 cultivarsin px, no ruler
Real recordingversion 4.0, light theme: 120 seeds from the dataset of Indonesian soybean cultivars (Syahraza et al. 2025, Mendeley Data, CC BY 4.0), one row per cultivar

One click per seed

The same wave, on other crops

Real images from public datasets, opened in SeedCounter 4.0. Each click releases the wave, which grows from the clicked point to the edge of the seed and measures the outline. The soybean scene on the home page is drawn; these are photographs.

Real recordingversion 4.0, real image of vitreous durum wheat (Kaya and Saritas 2019, CC0): 18 grains, one click on each
Real recordingversion 4.0, real peanut image (Peanuts, Roboflow 100, Capalungan, Daguio, Balbuena and Rafael, CC BY 4.0, crop): 15 seeds, one click on each

From dashed to solid

The machine proposes, you check

Find objects proposes the dashed outlines, and you apply them and check what is left. In each crop the checking asks for a different gesture: adding the missed seed with one click, or deleting what is not a seed. The first two are photographs from public datasets. The next three are synthetic scenes, built from seeds cut out of datasets with ground truth and placed on backgrounds with noise, fibers and dust, so that the number of seeds in the image is known in advance.

Real recordingversion 4.0, real image of durum wheat (Kaya and Saritas 2019, CC0): Find objects proposes 13 grains, the wave adds the 4 dark ones and the total reaches 17
Real recordingversion 4.0, real image of peanut (Peanuts, Roboflow 100, Capalungan, Daguio, Balbuena and Rafael, CC BY 4.0): of the 51 proposals, one is the edge of the plate; the Inspector shows the thin, long outline, it is deleted and 50 remain
Real recordingversion 4.0, synthetic scene with 23 forage seeds from LZUPSD (Yuan et al. 2024, CC BY 4.0, adapted) on simulated blue paper with fibers and dust: Find objects proposes 20, the wave adds the 3 dark or grayish ones
Real recordingversion 4.0, synthetic scene with 20 coffee beans from the Coffee Bean Dataset (Ontoum et al. 2022, CC BY-SA 4.0, adapted) on light paper with uneven lighting: Find objects proposes 19, the wave adds the green bean that was left out
Real recordingversion 4.0, synthetic scene with rice (Rice Image Dataset, Koklu, Cinar and Taspinar 2021, CC0) and soybean with defects (Lin et al. 2023, CC BY 4.0, adapted) on a dark background with grain and dust: all 25 seeds are found in the first proposal

Where it has not worked yet in our tests: seeds touching one another, such as piled-up wheat grains or rows with no gaps; light soybean on a gray background, where the outline picks up the shadow; and plates full of orchid seeds on blue paper. In these cases the count comes from the wave, seed by seed, or from the optional model.

In preparation

On the bench, being photographed

Each of these will show a real sample from start to finish. The dashed frame marks each one's place and shows its code from the list of examples.

Counting and measuring

Soybean: count and measure the seed lot

A commercial soybean sample on a dark background, with a ruler in the same plane. The starter case: large, separated seeds, to see the whole workflow and how long each step takes.

  1. Load the photo and mark 10 mm on the ruler to set the scale.
  2. One click per seed with the wave tool, or the optional AI proposing all of them.
  3. Check in the gallery, seed by seed.
  4. Export the spreadsheet with area, length and width in millimeters.
Real soybeans, counted and measuredE01 · real examples
Real example coming soon · E01to be photographed: 50 to 100 soybean seeds with a ruler

Tetrazolium

Orchid: color decides

Seeds of about 1 mm, elongated and often touching. In tetrazolium, the viable embryo turns red. The analyst marks each seed viable or non-viable, with a disc and a ring, and the plate's viability is calculated on the spot.

  1. Load the photo of the plate taken under the stereo microscope, with the scale.
  2. Outline the seeds and let the app propose viable or non-viable.
  3. Review the proposal in the gallery, filtering by class.
  4. Read the plate's viability in the panel, along with the number of seeds checked.
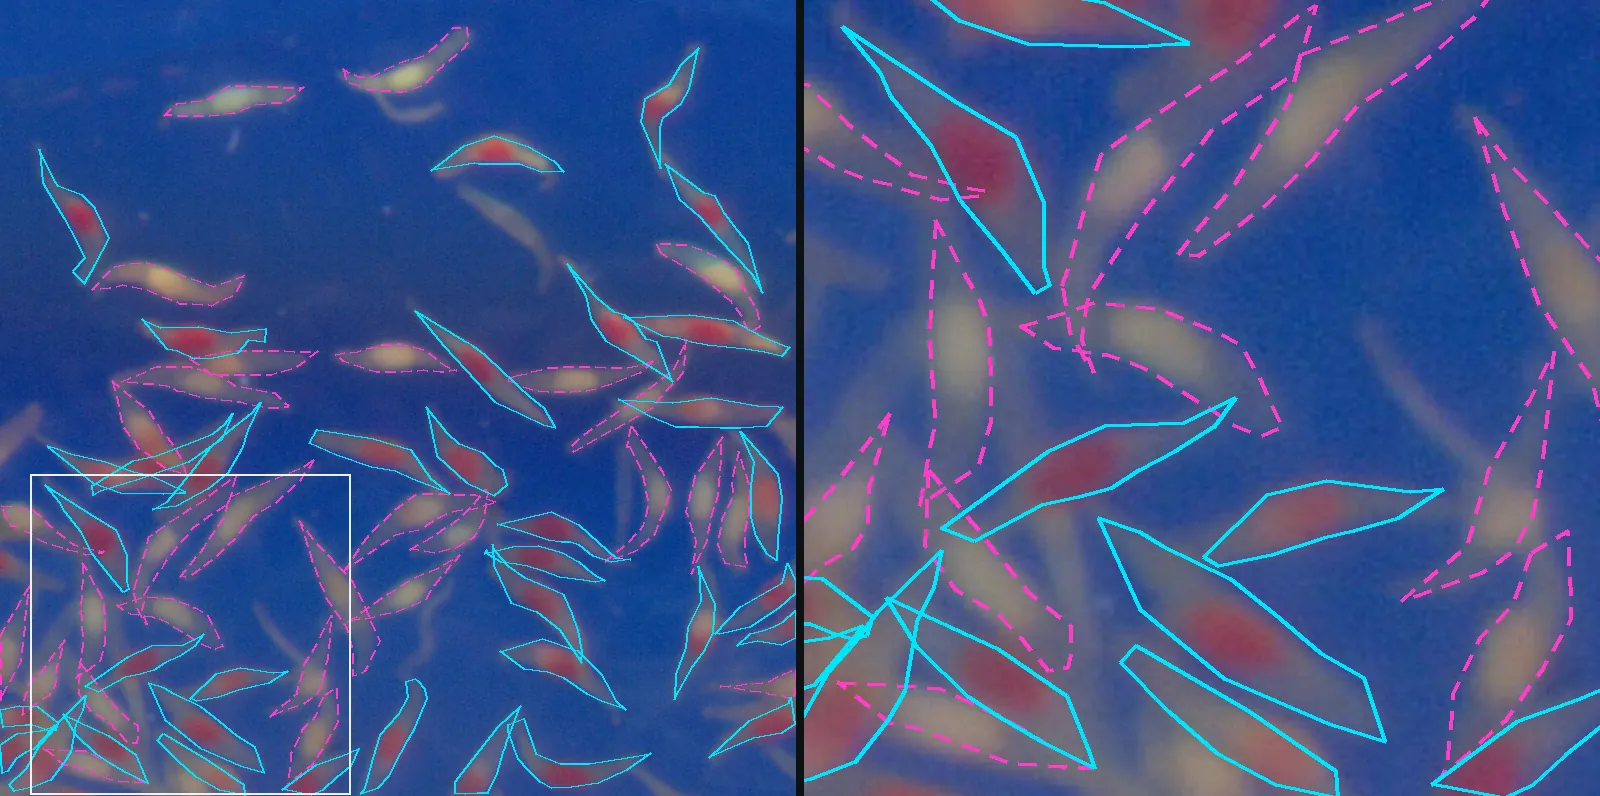
Real orchid plate in tetrazolium on blue paper, with viable seeds outlined in solid cyan and non-viable ones in dashed magenta, and a magnified detail.
Real dataplate from the public dataset Sementes de Orquídeas (CC BY 4.0), with the outlines and classes from the labels; the analysis recorded in the app is example E02

Protocol classes

Forage grass: full or empty

Spikelets that look alike on the outside. The full one has a caryopsis and the empty one does not. This is the case where viable and non-viable are not enough and the protocol classes come in: "full", "empty", "dormant", "dead".

  1. In the forage grass profile, the protocol classes are right at hand.
  2. Mark each spikelet and check the proportion of each class.
  3. Save the session to resume or compare seed lots later.
Forage grass spikelets, full and emptyE03 · real examples
Real example coming soon · E03to be photographed: spikelets of Urochloa or Megathyrsus with a ruler

Germination · over the days

Germination: from the daily count to t50

Each count in the test becomes a point. The Germination tab builds the cumulative curve, calculates indices such as t50 and compares treatments. To track a stored seed lot, you repeat the same test each time seed is taken out of storage.

  1. Photograph the same gerbox (germination box) every day, with the same framing.
  2. Record the counts for each day of the test.
  3. See the cumulative curve and the t50 for each treatment.
  4. Compare seed lots and export the data for your own statistics.
A germination test, day by dayE06 · real examples
Real example coming soon · E06to be photographed: the same gerbox over several days, counts in the Germination tab

App demos

Synthetic scenes with a known right answer

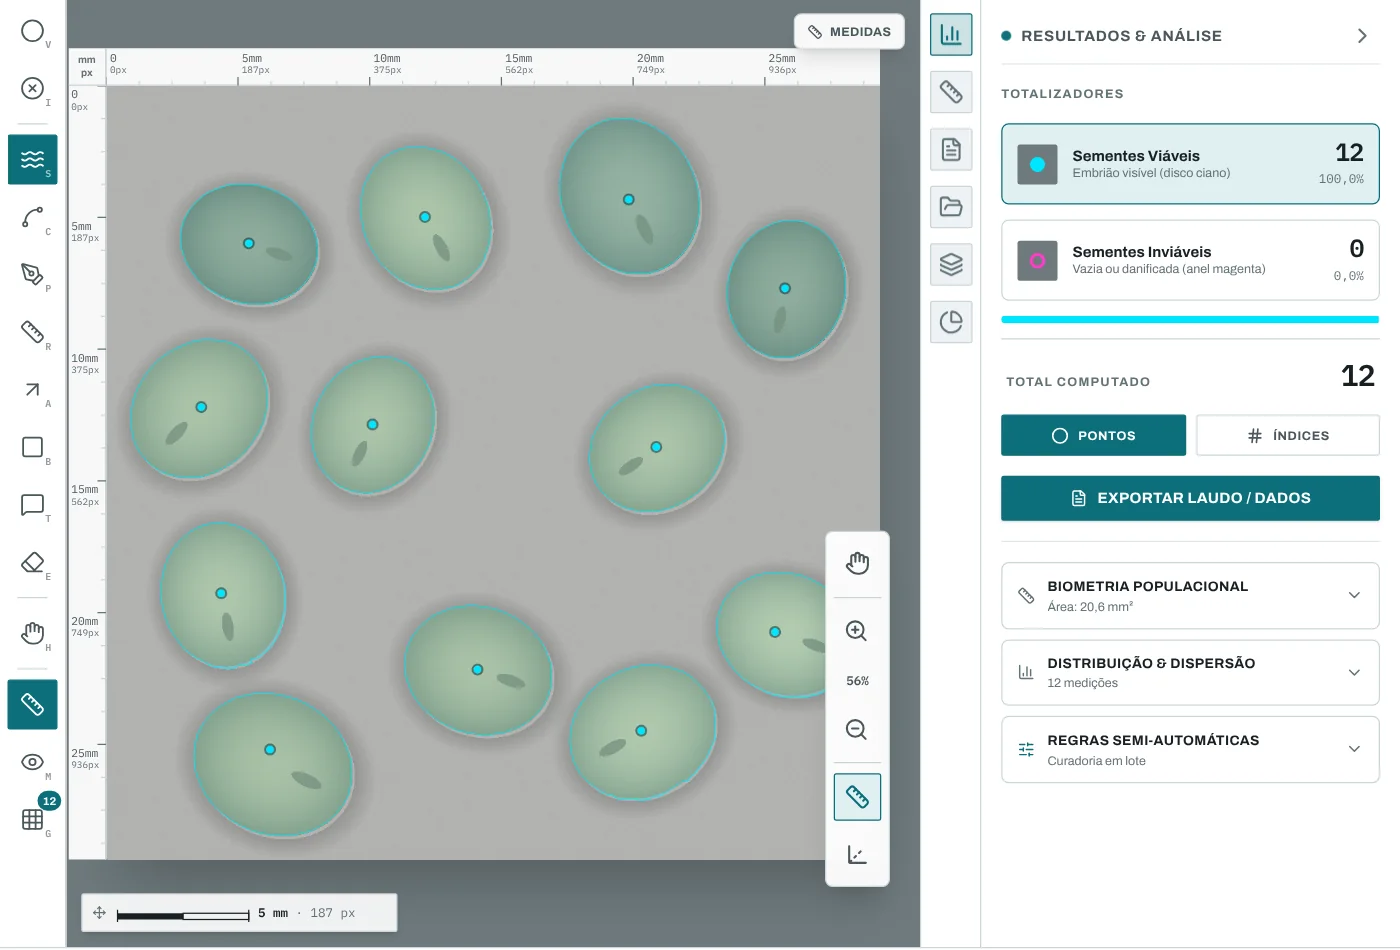
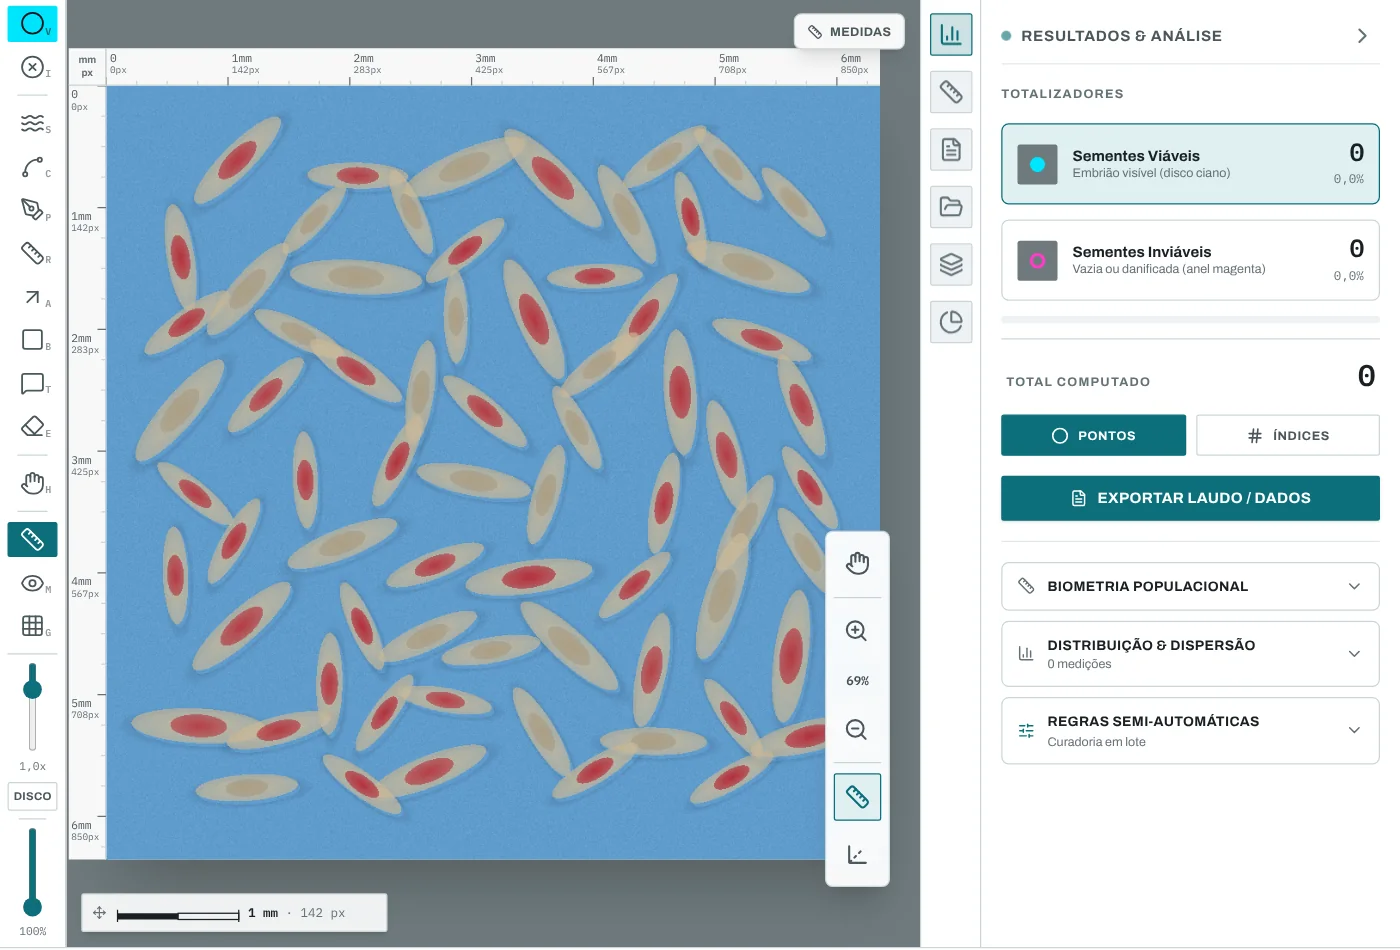
SeedCounter comes with scenes drawn in code, under Examples in the sidebar. They are not real seeds: they are there to help you learn the workflow and compare your count with the true one.

SeedCounter screen with twelve synthetic soybean seeds outlined in cyan and the panel showing 12 seeds.
Demo

Soybean

Twelve seeds, one click on each, count and mean length using the scale.

SeedCounter screen with synthetic orchid seeds on a blue background, each with a red embryo.
Demo

Orchid TZ

Elongated seeds with a stained embryo, for practicing classification.

SeedCounter screen with synthetic forage spikelets, some full and some empty.
Demo

Forage grass

Full and empty spikelets for the protocol classes.

Demo

Gallery by size

The twelve seeds from the soybean scene stacked by length, in the beta version.

Do you have a sample that would make a good example?

If you want to see your seeds here, with your name in the credits, write to us and tell us the crop and the test.

Write to us