Germination
Counts day by day and at each withdrawal from storage, comparing treatments and seed lots.
Storage and viability

SeedCounter by Hilum
Load a photo or a scan. SeedCounter proposes the outline of each seed, you check it, and you get the count, viability and measurements in millimeters, with a test report. It opens in the browser, with nothing to install.
real image · 38 seeds annotated by GPEOrq
On seed researchers' benches
How it works
The app does not decide on its own. Every proposal appears as a dashed outline and only becomes data when you accept it.
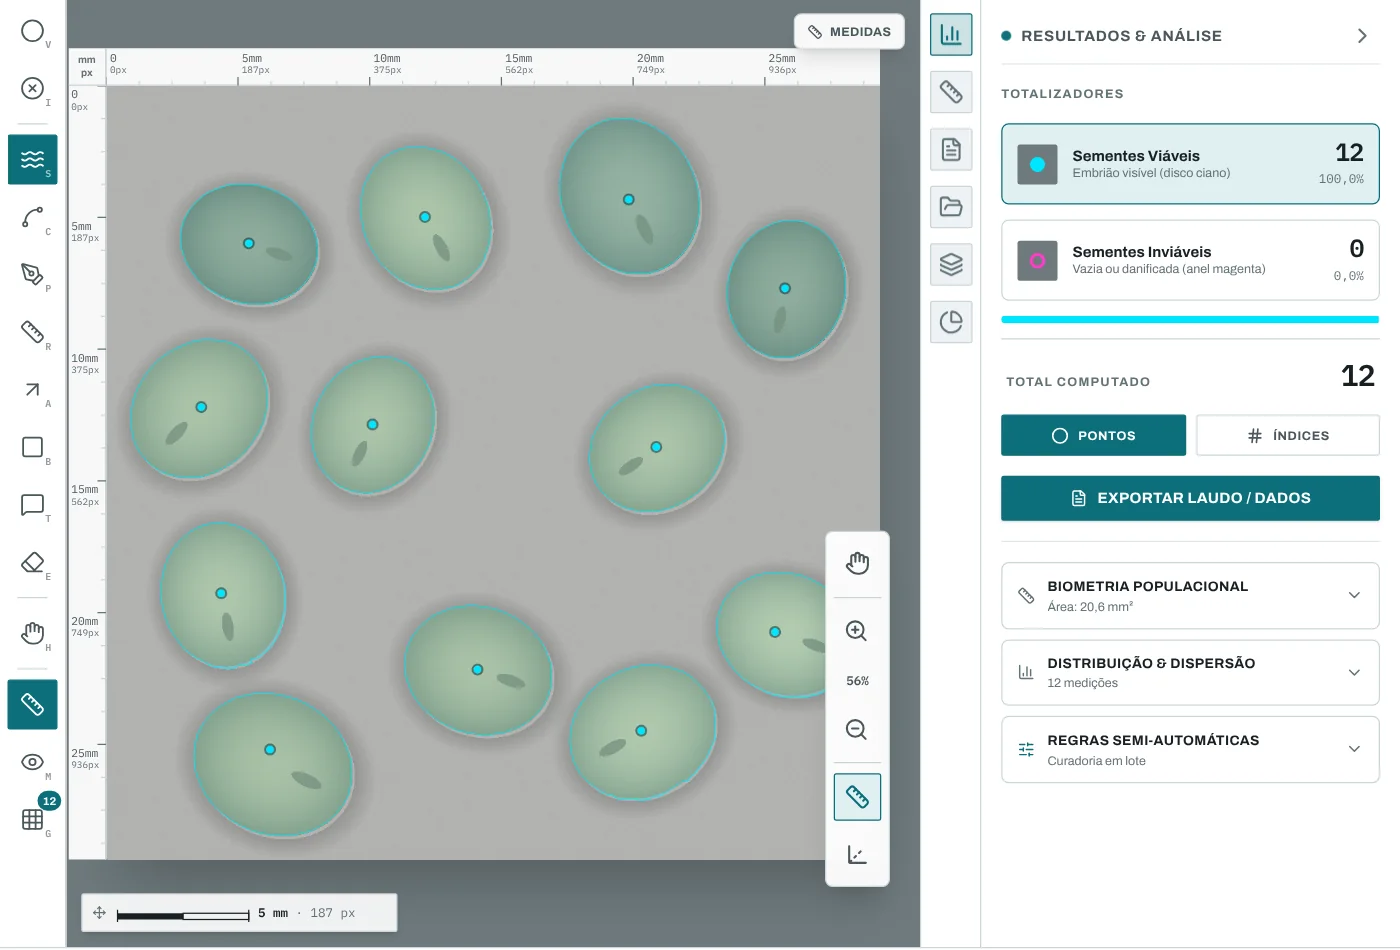
A photo from a phone or camera, a scan from a flatbed scanner, a multipage TIFF or the live camera. The ruler in the image gives the scale.
One click and the wave outlines the seed out to its edge. For large batches, the optional AI suggests the seeds for the whole queue.
Accept, fix the outline or change the class: viable, non-viable or the classes in your protocol. Nothing goes into the count until you have checked it.
Test report as PDF, CSV spreadsheet, SQL database and a dataset for training models. Measurements come out in millimeters, with the scale recorded.
Test your eye
The plate appears for a few seconds. Make your guess and watch SeedCounter count them one by one.
More animations in LearnThe plate stays on screen for 4 seconds and then disappears.
Plates generated on the spot, with model seeds. In the app, you count your own image: open SeedCounter.
What it does
On the left, the animation that explains what happens. On the right, the same step in SeedCounter. Ideas are born as animations and become tools.
The seed is separated from the background by color and the outline is measured on the spot.
Otsu threshold, outline and Feret
Seeds stack up by length and the seed lot becomes a distribution.
50 model seeds
A ruler photographed next to the seeds becomes the scale. The file's DPI is only a declaration.
20 mm = 3,790 px · 1 px = 5.28 µm
Area, circularity, solidity and the Feret diameters of each seed, with the axes drawn on it.
The numbers of a shapethe rotating caliper
Viable and non-viable seeds get marks of different shapes, a disc and a ring, so the figure stays legible even printed in black and white.
tetrazolium, 36 of 65 viable
Counts day by day and at each withdrawal from storage, comparing treatments and seed lots.
Storage and viabilitySeveral images in a queue, multipage TIFF and a scan sliced into plates.
For everyday lab workCapture straight from the camera connected to the computer, without going through another program.
The right benchProcessing happens in the browser. No image goes to a server.
Why it runs in the browserCome back to a plate later, with the image, the marks and the outlines.
Open SeedCounterTest report as PDF, CSV, SQL and a YOLO dataset to train your own model.
The statistics behind the test reportWho it's for
The app opens straight to the workbench. If you like, pick a profile on the opening card: it only adjusts what appears on screen, takes effect right away and can be changed later.
Many plates a day: count, issue the test report and move on to the next one.
For labsTouching orchid seeds, multipage TIFF and every number with its origin.
Orchid seeds in tetrazoliumFull or empty spikelet, dormant or non-viable, and germination every week.
Full or empty forage seedsMark, count and see the number, with the app pointing out the next step.
Learn with animationsProject only the image and the marks, without changing anything on the computer.
Open in presentation modeExamples
The examples are being made with real seeds: photographed at the bench, analyzed in SeedCounter and shown step by step, with the final result.
Real example coming soon · E04Morphometry
Two kinds of rice photographed with a ruler, told apart by shape in shape space.
Real example coming soon · E02Tetrazolium
1 mm seeds where the color of the embryo decides, not the shape.
Real example coming soon · E01Counting
A commercial sample, counted and measured seed by seed, with the histogram of the seed lot.
Science
Before it becomes a feature, each measurement is checked against published data. What we still get wrong is written down.
On 1,904 rice grains measured by SeedCounter and in the Koklu et al. dataset, seven descriptors matched with 0.00% error. The other differences come from calculation conventions.
The rice exampleTheory predicts 8(√2−1)/π = 1.054786. The published dataset shows 1.054052. A difference of 0.07%.
Shape and geometryThe outline simplified to 48 sides overestimates circularity in seeds with low solidity. That is measured and explained, and the fix is the next step.
Blog
One idea a week, with the animation, the math and what we still get wrong.
The first post is coming soon.
For labs
With raking light, a seed's shadow touches its neighbor and two become one. If you're going to use it every day, we work with you on what goes around the app: the capture bench, the classes in your protocol and validation with your own samples.
Where it came from
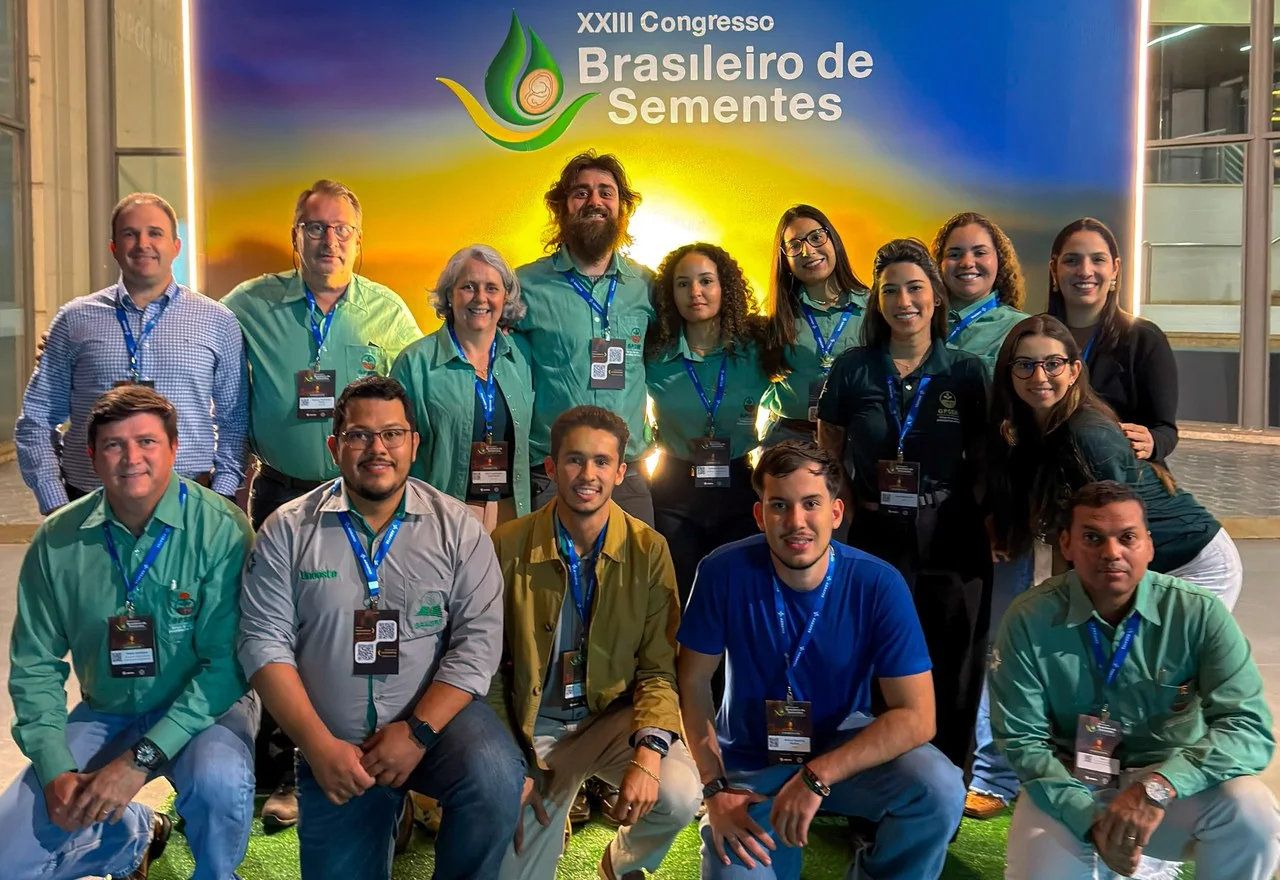
SeedCounter began as an answer to a bench problem at GPEOrq and GPSEM, the orchid and seed research groups: how to count and measure orchid seeds, among the smallest there are, without spending the whole day at the microscope. The group had been reading tetrazolium tests from scanner images since 2011; the app turned that reading into counts, measurements and a test report.
The app comes with example scenes of known count, so you can compare what it finds.
This site uses Google Analytics and Microsoft Clarity to learn which pages get read, and none of it loads before you choose.