

Theory · Shape
Shape is what is left after removing position, rotation and size.
Two seeds can sit in different corners of the plate, each turned a different way, one larger than the other, and still have the same shape. This track shows how to separate shape from the rest, with real orchid seeds, and which numbers SeedCounter uses to describe it.
Understand · visual
Removing position, rotation and size
On a plate, each seed has a position, an orientation and a size. None of this is shape. If the seed rolls to one side, if the plate turns or if the photo is taken closer, the shape stays the same. So the three can be removed, one at a time, to see what is left.
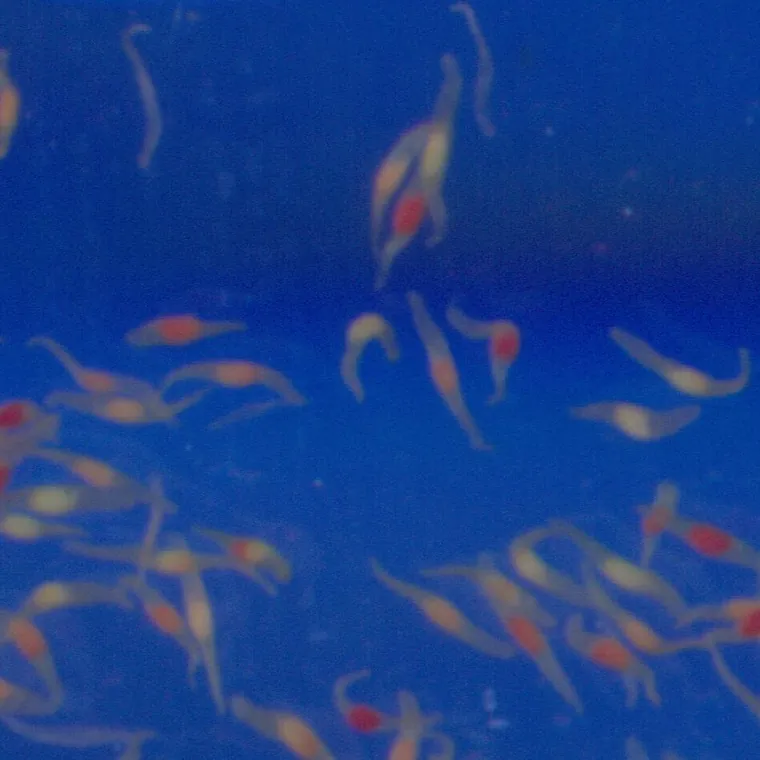
The center used is the centroid, the balance point of the seed. The rotation lays flat the major axis of the inertia ellipse, the direction in which length is measured. Size is removed by dividing everything by the length. After the three steps the 24 seeds become a bundle, and what still separates one from another is shape alone: one plumper, another more curved, another with a finer tip.
Definition
Two figures have the same shape when one becomes the other by a translation, a rotation and a change of scale. This is Kendall's definition, the basis of statistical shape analysis [1][2]. The mirror image is left out: a curved seed and its mirror image have the same shape only if the seed is symmetric. That is why, in the alignment above, the seeds rotate but are never mirrored.
Size in pixels misleads
The orchid set in the kit has 38 crops of tetrazolium plates, with 1,614 seeds outlined in the set's label and marked as viable (red embryo) or non-viable. Setting aside those that touch the edge of the crop leaves 1,407: 775 viable and 632 non-viable. When the length of each one is measured in pixels, the viable seeds look much larger, with a median of 144 px against 90 px.
But the crops are not at the same scale. The median length per crop ranges from 69 to 189 px, and the classes are not spread evenly among them: some crops hold almost only non-viable seeds, which look small in the image. With no ruler in the photo, there is no way to know how much of this is larger seeds and how much is different magnification. When each length is divided by the median of its crop, the difference nearly vanishes (right-hand plot). In the 16 crops with at least five seeds of each class, the viable seed comes out, at the median, only 5% longer than the non-viable seed from the same crop.
What remains
A pixel measures the seed and the zoom at the same time. Comparing size requires a scale, the ruler in the photo (see from pixel to millimeter). Comparing shape does not: a shape descriptor is a ratio between measurements of the same seed, has no unit, and the zoom cancels out in the calculation.
The mean shape of each class
With position, rotation and size removed, the seeds can be overlaid and averaged. Each aligned outline becomes a mask, the masks are summed, and the curve where half of the seeds cover the point is the mean shape. It is the same idea as the mean seed shape and the shape space of the 145 silhouettes in Learn, now with the orchids separated by class.
The mean viable seed is slightly more elongated than the non-viable one: a length-to-width ratio of 4.2 against 3.8. The difference exists, but it is small next to the variation within each class, which the 25% and 75% curves show. Shape alone does not decide viability. The tetrazolium test exists precisely because the decision lies in the color of the embryo, not in the outline.
Where it fails
The label polygons are coarse. Half of them have 11 vertices or fewer, and 83% have between 5 and 20. An outline like this cuts off the tips and smooths the curves. It works for shape at the scale of the whole grain, such as elongation and curvature, but not for fine edge detail or for perimeter. How much this affects each descriptor is worked out in Shape descriptors.
Three numbers for shape
A whole shape does not fit in a spreadsheet column. A shape descriptor summarizes the outline in a number that does not change with position, rotation or size. Three of them are enough to start, and each one sees something different.
Elongation is the length divided by the width. Here it comes from the rotating caliper around the seed, the Feret diameters: the largest opening over the smallest. It equals 1 for a circle and is close to 4 for an orchid seed.
Circularity compares the area with the perimeter, \(4\pi A/P^2\). It equals 1 for a circle and for no other figure, and it drops when the shape elongates or when the edge becomes indented. An ellipse that is twice as long as it is wide gives about 0.84.
Solidity is the area of the seed divided by the area of its convex hull, the rubber band stretched around it: \(A/A_{\text{fecho}}\). It equals 1 for a seed with no concavity and drops when the seed is curved, when it has a notch, or when two touching seeds become a single object.
Instrument · real crops in a row
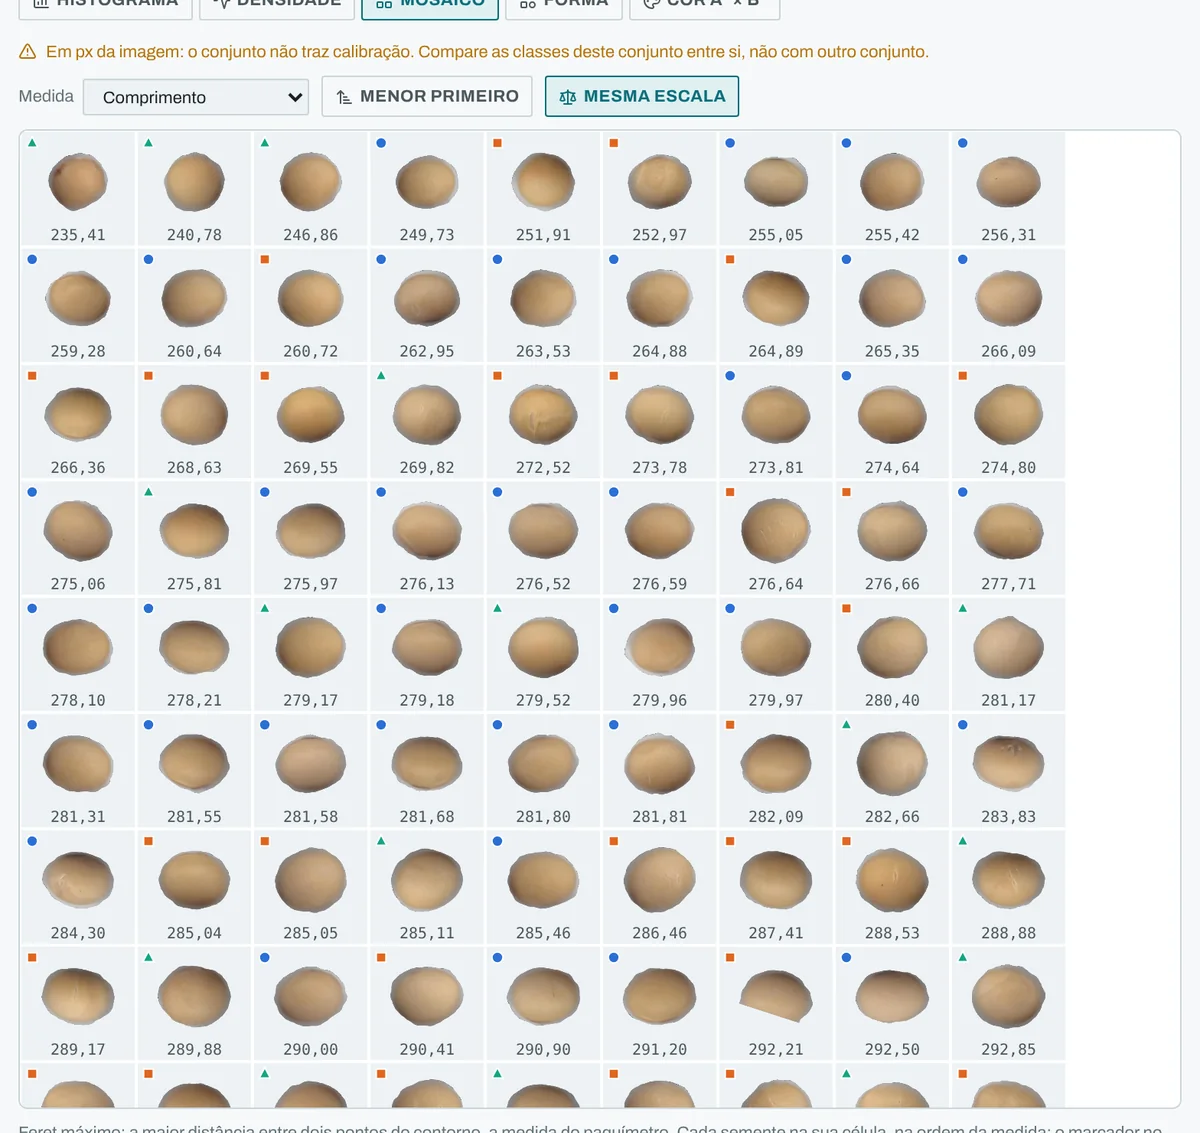
Each crop was rotated until the major axis lay flat and enlarged until the length filled the same fraction of the cell, and the image outside the outline was darkened. The number comes from the label polygon, drawn on top (solid for viable, dashed for non-viable). With the chosen solidity, the dashed orange line is the convex hull: what lies between it and the outline is what the seed lacks to be convex. Note that some low solidity values come from a crooked tip in the label, not from the seed.
It is worth looking at the row sorted by each of the three descriptors. Elongation and circularity move together, because a long seed has a large perimeter for the area it covers. Solidity takes another path: a seed can be short and low in solidity (curved like a comma) or long and fully solid (straight like a spindle). So none of the three replaces the others.
Data
Dataset "Sementes de Orquídeas" v8, Roboflow Universe (universe.roboflow.com/sementes-de-orqudea/sementes-de-orquideas), license CC BY 4.0. Crops of 946 × 946 px, with no millimeter scale; validation split, 38 images. Figures and numbers regenerated by the site's _src/figuras/teoria-forma.py script.
In SeedCounter
In SeedCounter
Every seed outlined in the app, by click, by the optional AI or by hand, gets area, perimeter, circularity, length and width along the principal axes, and the maximum and minimum Feret diameters. With the scale measured from the ruler, area and lengths come out in mm² and mm. Ratios such as elongation and circularity have no unit and hold even without a ruler, as long as the compared images have the same resolution. The outline the app stores has up to 48 sides, and this affects the circularity of seeds with low solidity; the calculation is in Where it fails. In the dataset hub, the Shape view aligns the outlines of a whole dataset and shows the mean seed shape of each class, and the Mosaic sorts the seeds in a row by the chosen measurement.
Go deeper
Shape descriptors
Area, perimeter, circularity, Feret, aspect ratio and solidity: the formula, the convention and the bias of each, with a polygon to play with.
formulas · instrument · references Go deeperElliptic Fourier
The whole outline as a sum of rotating ellipses, and how many terms a seed asks for.
formulas · references Go deeperPCA, SVD and the mean seed shape
Many shapes at once: the mean, the directions in which seeds vary most, and the shape space.
formulas · referencesTo see it in motion: the rotating caliper around the seed, the seed drawn with circles and the post A seed is a sum of circles, with the video.
Further reading
- Kendall D. G. (1984). Shape manifolds, Procrustean metrics, and complex projective spaces. Bulletin of the London Mathematical Society 16(2), 81–121. doi:10.1112/blms/16.2.81
- Dryden I. L., Mardia K. V. (2016). Statistical Shape Analysis, with Applications in R. 2nd ed. Wiley.
- Tanabata T., Shibaya T., Hori K., Ebana K., Yano M. (2012). SmartGrain: high-throughput phenotyping software for measuring seed shape through image analysis. Plant Physiology 160(4), 1871–1880. doi:10.1104/pp.112.205120
- Koklu M., Ozkan I. A. (2020). Multiclass classification of dry beans using computer vision and machine learning techniques. Computers and Electronics in Agriculture 174, 105507. doi:10.1016/j.compag.2020.105507
Grain phenotyping programs measure these same numbers: SmartGrain measures length, width, area, perimeter and circularity [3], and the dry bean dataset of Koklu and Ozkan has 16 dimension and shape descriptors for 13,611 grains [4].
The shape of your seeds, seed by seed.
SeedCounter measures every seed you outline and check, right in the browser.