

Theory · Color and class
Color proposes the class, you check.
In the tetrazolium test, the living embryo turns red. Measuring that red in an image calls for three decisions: which color space to measure in, how to take the mean of an angle, and what a mean will never see. This page shows all three with 1,614 real orchid seeds.
Understand · visual
One plate, two classes
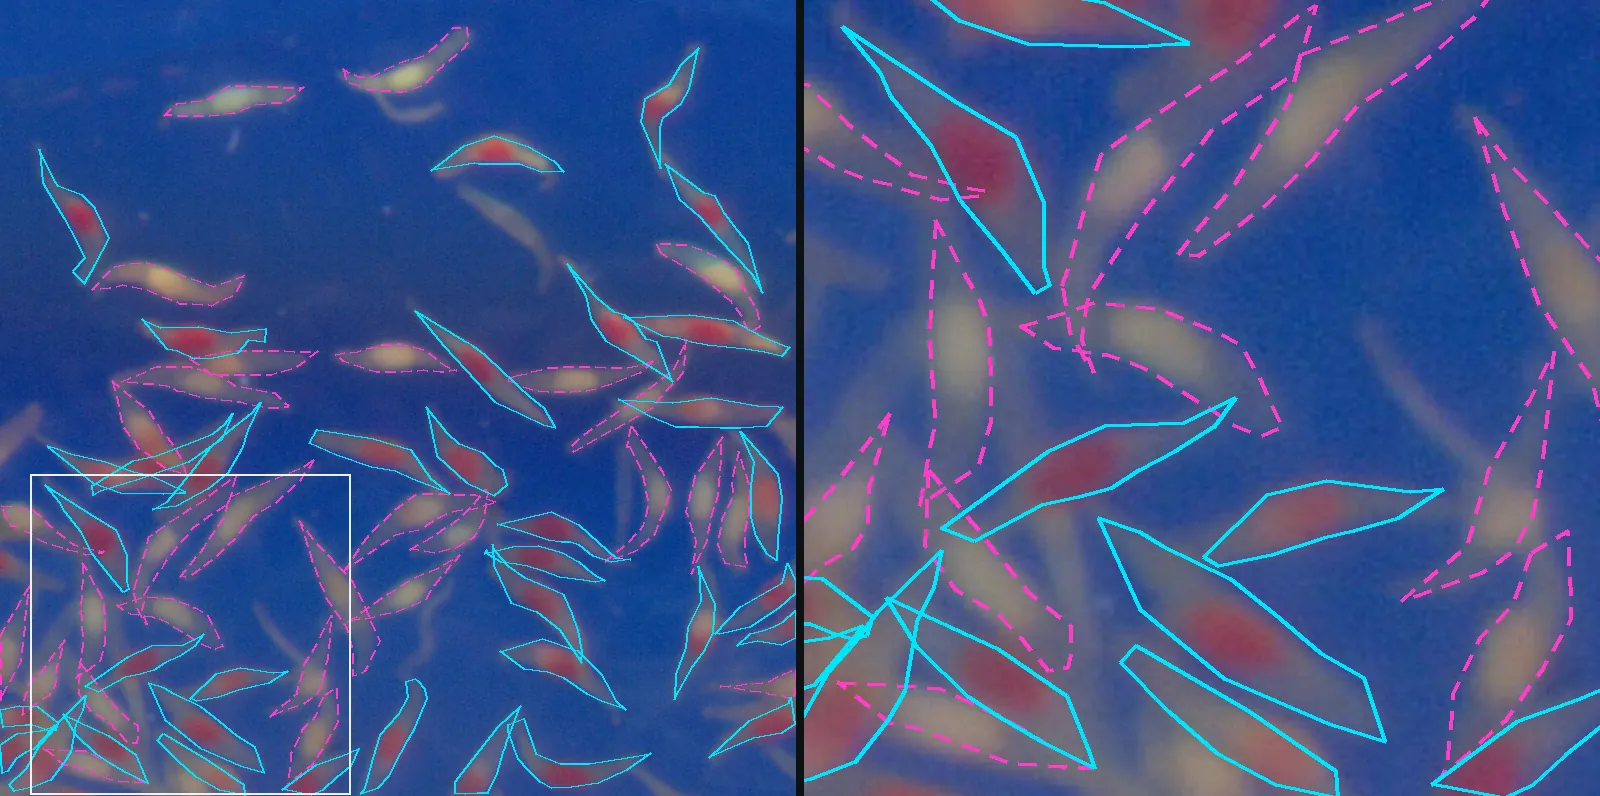
Figure 1 is a real crop from an orchid tetrazolium plate, scanned on blue paper. The tetrazolium salt goes in colorless, and respiring tissue turns it into a red compound. That is why the embryo of viable seeds appears as a red patch inside the pale coat. The chemistry is in the post Red embryos breathe and, in motion, in the tetrazolium animation.
The polygons come from the annotation of the public dataset and are coarse: most have few vertices (the median is 11). They say where each seed is and which class the annotator gave it. The 38 crops have 1,614 annotated seeds: 926 viable and 688 non-viable. Annotation is also a reading, and someone annotating again would decide some boundaries differently. The post Counting isn't enough discusses this with soybean seeds.
From RGB to CIELAB
The camera and the scanner store each pixel as three numbers, R, G and B, from 0 to 255. They say how much red, green and blue to light up on a screen, and they mix two things the analysis wants kept apart: how light the pixel is and what color it is. The same seed in shadow and in light has a very different RGB.
CIELAB swaps the three numbers for three others. L* is lightness, from 0 (black) to 100 (white). a* runs from green (negative) to red (positive). b* runs from blue (negative) to yellow (positive). The calculation has three steps: undo the gamma curve of sRGB, convert the result to XYZ space with a fixed matrix, and apply a cube root and differences [1]:
Here \(f(t) = t^{1/3}\), replaced by a straight line near zero, and \((X_n, Y_n, Z_n)\) is the reference white, D65 daylight. Y is luminance and weights green most heavily. X gives more weight to red. When red dominates green, \(X/X_n\) exceeds \(Y/Y_n\) and a* becomes positive. That is what a* measures: how much redder than green the pixel is.
| Real pixel | sRGB | linear | XYZ | L* | a* | b* |
|---|---|---|---|---|---|---|
| embryo | 119, 61, 85 | 0,184 0,047 0,091 | 0,109 0,079 0,095 | 33,8 | 28,4 | −3,0 |
| paper | 6, 58, 153 | 0,002 0,042 0,319 | 0,073 0,054 0,308 | 27,7 | 24,3 | −55,8 |
Table 1. Two pixels from the plate, one from the embryo of a viable seed and one from the paper, step by step. Pure sRGB red, (255, 0, 0), gives L* 53.24, a* 80.09 and b* 67.20, the reference value against which the calculation is checked.
The table holds a surprise. The blue paper also has a positive a*, 24.3. The CIELAB blue leans toward violet, and violet contains red. What separates the paper from the embryo is b*: −55.8 against −3.0. The color of a pixel is the pair (a*, b*), and the a* axis alone works only as long as the background does not confuse it.
The mean color of each seed
For each seed, the calculation goes through all the pixels inside the polygon, converts each one to CIELAB and takes the mean of L*, a* and b*. Figure 2 shows six seeds from the set, three of each class, chosen near the a* quartiles of their class. The colored strip under each one is the mean color.
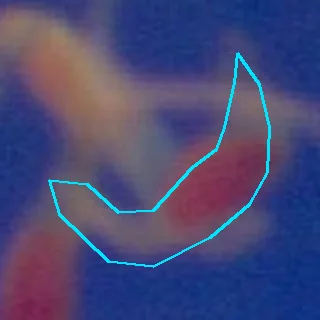





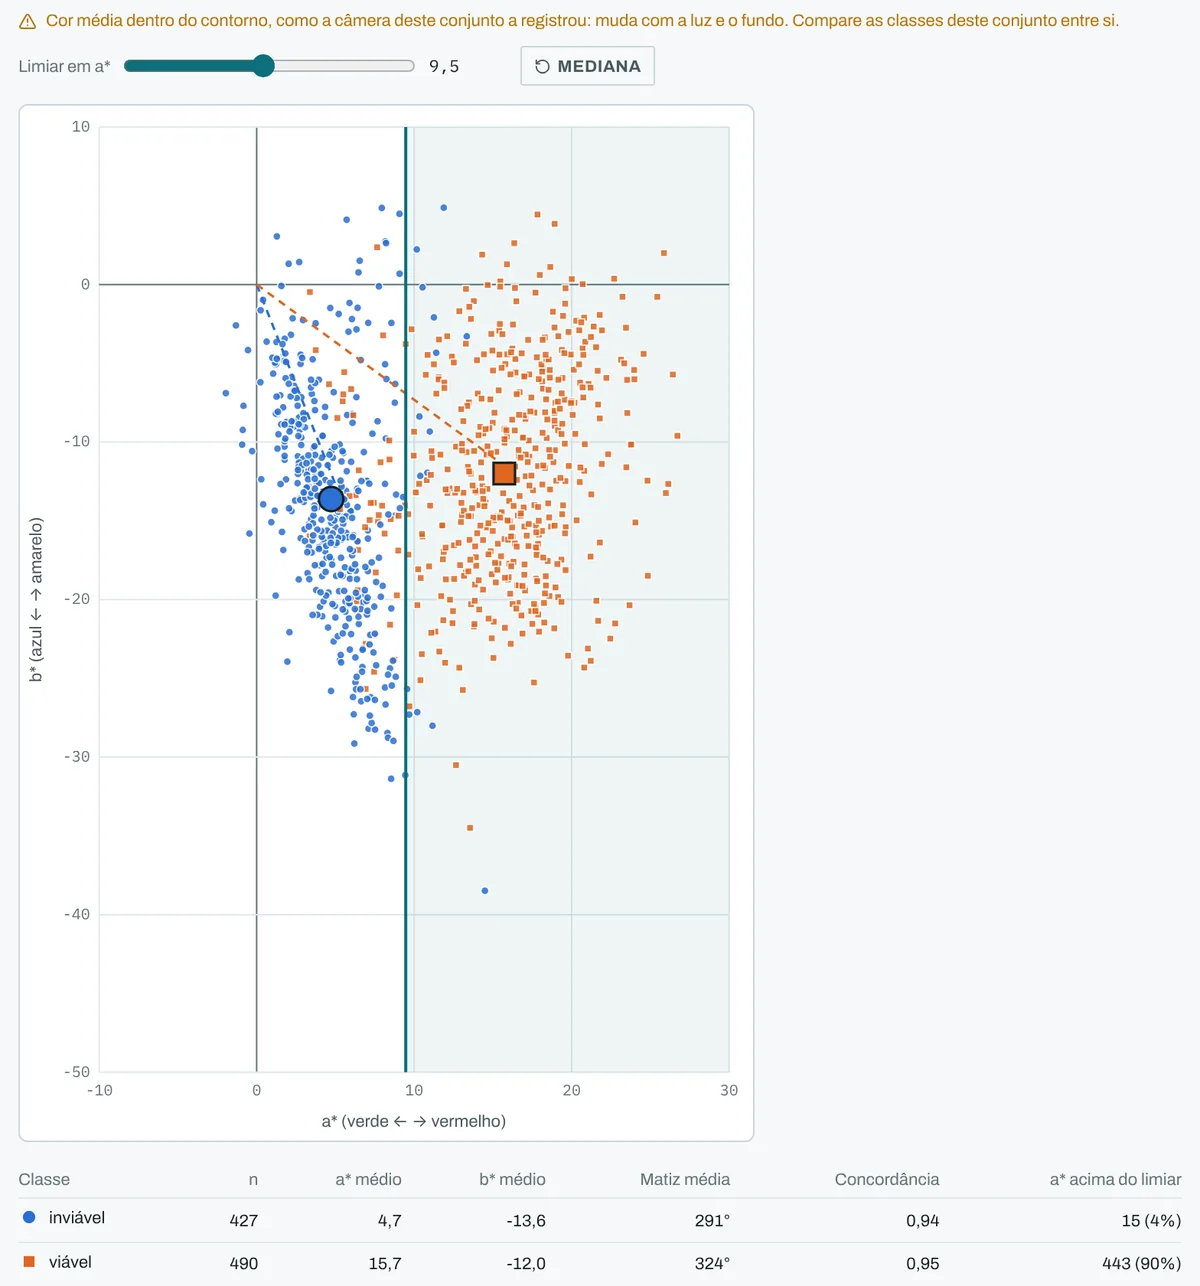
The mean color is a mixture. The polygon takes in the embryo, the pale coat and a rim of blue paper, and the mean pulls everything toward a grayish violet. Even so, the class shows through: the median a* is 16.5 in viable seeds and 4.8 in non-viable ones. The instrument below places the 1,614 seeds in the (a*, b*) plane and lets you choose a threshold.
Instrument · a threshold on a*
Each mark is a real seed, at its mean color. solid cyan circle: viable label. magenta ring: non-viable label. orange ring: the threshold proposal disagrees with the label. Real data
With the threshold at 9.4, the value that best matches the label on these seeds, the rule agrees with it on 1,510 of the 1,614 (93.6%). This number is optimistic, because the threshold was chosen by looking at the same seeds. When the threshold is chosen on 37 crops and tested on the one left out, one crop at a time, the agreement is 1,502 (93.1%). That leaves 104 seeds where the rule and the label disagree, and 78 of them are within 3 a* units of the line. That is where the analyst's checking pays off most.
Hue is an angle
The same (a*, b*) pair can be described by distance and angle. The distance to the origin is chroma, \(C^* = \sqrt{a^{*2} + b^{*2}}\), how vivid the color is. The angle is hue, \(h = \operatorname{atan2}(b^*, a^*)\). Zero degrees points to +a*, red. 90° points to yellow, 180° to green and 270° to blue. Tetrazolium red sits near 0° and sometimes drifts slightly toward the magenta side, near 360°.
Here lies the trap. 359° and 1° are nearly the same color, but the arithmetic mean of the two is 180°, green. In a red seed, some pixels fall just above 0° and some just below 360°, and the arithmetic mean points to the opposite side of the circle.
The correct calculation treats each hue as an arrow of length 1, adds the arrows and reads the angle of the sum [2]:
\(\bar R\) goes from 0 to 1 and says how much the hues agree. Near 1, they all point the same way; near 0, they spread around the circle and the mean carries no meaning. Among the 926 viable seeds, the arithmetic mean of the pixel hue falls more than 90° from the circular one in 192 of them, and more than 45° in 366. Among the 688 non-viable seeds, which are paler, this happens in 73. The trap catches precisely the class that matters.
There is a shortcut worth keeping. Taking the mean of a* and b* and only then computing the angle gives exactly the circular mean, with each pixel weighted by its chroma. Across the 1,614 seeds, the two calculations differ by less than \(10^{-13}\) degrees, which is computer rounding. Anyone who stores the mean of a* and b* already has the correct hue.
Instrument · arithmetic mean and circular mean
Drag the points around the circle. Rotate the set slowly: when a point crosses 0°, it jumps from one end of the line to the other and the arithmetic mean jumps with it, while the circular mean turns smoothly. The real pixels are 72 drawn at random from each seed, with the CIELAB hue.
What color decides, and what it does not
The mean color separates these two classes well because, in this dataset, viable means a red embryo and non-viable means a pale embryo. This is a protocol criterion, valid for the material and for whoever defined it. The standard asks for more.
Tetrazolium is a topographic test: the reading looks at where the stained and unstained tissue lie and how much of the embryo each one occupies [3]. In the Brazilian Rules for Seed Testing, the tetrazolium chapter gives, species by species, drawings and photos of viable and non-viable embryos, and what changes from one to the other is mostly the position and extent of the unstained areas [4]. A pale area at the tip of a cotyledon may be tolerated; the same area on the axis of the embryo condemns the seed. A mean has no position.
Also left out are intensity, since a red that is too dark usually indicates deteriorating tissue; the firmness of the tissue, which only touch can assess; and the light in the photo: without a gray card in the scene, the same red changes from one session to the next. Saying where the color is requires the outline of the seed and a position inside it, and that is already the subject of the shape track.
In orchids, the test has its own steps before the reading. Without preconditioning in sucrose, tetrazolium underestimates viability [6]; in species with a dark seed coat the embryo only shows after the stained seeds are bleached, and in those with a thick carapace the salt only enters if the seeds are scarified first [7]. The reading itself can be done on the image: in signal grass (Urochloa) seeds, reading the tetrazolium test from a scanner image at 1,200 dpi gave the same result as reading it under the stereo microscope [8].
There is a measure of how large this limit is. On a public soybean dataset after tetrazolium, described by hundreds of global color and texture attributes, the balanced accuracy stopped near 0.67 no matter how many more seeds were added. Global attributes throw away the where. The calculation is on the Go deeper page.
More than two classes
Viable and non-viable is the most common pair, but many protocols use more classes. In orchids, it is common to count the empty seed, with no embryo, separately. In the seed vigor reading, viable seeds are divided into classes by the type and position of the damage. In purity and quality, the classes are different: intact, broken, immature, stained.
With three or more classes a problem appears that two classes do not have. If the classes line up in descriptor space, from the palest embryo to the reddest, for example, the simplest linear classifier, least squares, may never choose the middle class [5]. It disappears, however well separated it is from its neighbors. The proof, the remedies and what was measured in 88 species are in When the line hides a class.
In SeedCounter
In SeedCounter
Each seed comes out with the mean color inside the outline, in RGB, HSV and CIELAB, together with the shape measurements. The machine proposes the class, viable and non-viable or the classes of your protocol, and the proposal only becomes data after you check it. Viable has a solid outline and non-viable a dashed one, so the class stays legible without relying on color. In version 4.0 the mean hue of each class is the circular mean, and the dataset hub gained the Color a* × b* view, with one point per seed, the center of each class and an a* threshold to play with.
Where it fails
The a* value depends on the light, the sensor and the white balance. The threshold of 9.4 holds for these 38 images, with this scanner and this paper; on another bench it has to be measured again, with a few plates checked by hand. The coarse polygons put paper inside the mean, and a tighter outline would change the numbers. And the agreement is with the label of whoever did the annotation, which is also a reading.
Data
Dataset "Sementes de Orquídeas" v8, Roboflow Universe (universe.roboflow.com/sementes-de-orqudea/sementes-de-orquideas), license CC BY 4.0. Calculations on this page: the 38 validation crops and their 1,614 polygons; sRGB, XYZ (D65, 2° observer) and CIELAB conversion pixel by pixel; scale in pixels only.
Go deeper
When the line hides a class
Least squares with K classes, the proof of masking, LDA, logistic regression, SVD and what was measured in 88 species.
●○○ See · animationTetrazolium in motion
Twelve model seeds cut, stained and checked one by one.
●●○ Understand · trackShape
Outline, descriptors and the mean seed shape: what shape measures and where it stops.
Further reading
- ISO/CIE 11664-4:2019. Colorimetry. Part 4: CIE 1976 L*a*b* colour space. International standard, 1st edition, 2019.
- Fisher N.I. (1993). Statistical Analysis of Circular Data. Cambridge University Press. doi:10.1017/CBO9780511564345
- Moore R.P. (1985). Handbook on Tetrazolium Testing. International Seed Testing Association, Zurich.
- Regras para Análise de Sementes [Brazilian Rules for Seed Testing] (2025). Chapter 5, tetrazolium test, with guides and photos by species. wikisda.agricultura.gov.br
- Hastie T., Tibshirani R., Friedman J. (2009). The Elements of Statistical Learning, 2nd ed., chapter 4. Springer. doi:10.1007/978-0-387-84858-7
- Hosomi S.T., Santos R.B., Custódio C.C., Seaton P.T., Marks T.R., Machado Neto N.B. (2011). Preconditioning Cattleya seeds to improve the efficacy of the tetrazolium test for viability. Seed Science and Technology 39(1), 178–189. doi:10.15258/sst.2011.39.1.15
- Custódio C.C., Marks T.R., Pritchard H.W., Hosomi S.T., Machado-Neto N.B. (2016). Improved tetrazolium viability testing in orchid seeds with a thick carapace (Dactylorhiza fuchsii) or dark seed coat (Vanda curvifolia). Seed Science and Technology 44(1), 177–188. doi:10.15258/sst.2016.44.1.17
- Custódio C.C., Damasceno R.L., Machado Neto N.B. (2012). Imagens digitalizadas na interpretação do teste de tetrazólio em sementes de Brachiaria brizantha [Scanned images in the interpretation of the tetrazolium test in Brachiaria brizantha seeds]. Revista Brasileira de Sementes 34(2), 334–341. doi:10.1590/s0101-31222012000200020
The color of each seed, on your plate.
Load a tetrazolium plate, see the proposed class and check seed by seed.