Blog · Bench
We measured other people's faba beans
We took 16 public faba bean photos with a ruler in the frame, measured 160 seeds in SeedCounter and compared them with the authors' own analysis. In 11 photos, the difference in mean length was under 2%. The other 5 teach more.
November 17, 2026 · 8 min read · by Enrico S. Ambrosio
An image measurement is only trustworthy once someone checks it against a measurement that did not come from the image. That is what a rare kind of public dataset is for: photos of seeds with a ruler in the frame and, alongside, the measurements the authors themselves took of each seed.
This is the case with the faba bean (Vicia faba) photos from the Canadian government's breeding program, published by Ortega Polo and Larkan in 2026. Each photo shows one line, with 7 to 10 seeds on a blue background, an inch ruler, a coin and a 24-patch color card. The authors' table gives the length, width and area of each seed, measured with their own image analysis software.
How we measured
- We took the 16 published photos with 10 seeds each: 160 seeds.
- The scale came from the ruler in each photo. The 1/16-inch ticks repeat almost a hundred times along the ruler, and their period gives the pixels per inch: from 584 to 656, depending on the camera distance.
- In SeedCounter 4.1, one click on the center of each seed. The wave grows from the click to the edge and the outline is measured on the spot, the same way you would do it at the bench.
- The authors order the seeds differently, so we compare the mean of each photo, as they do themselves.
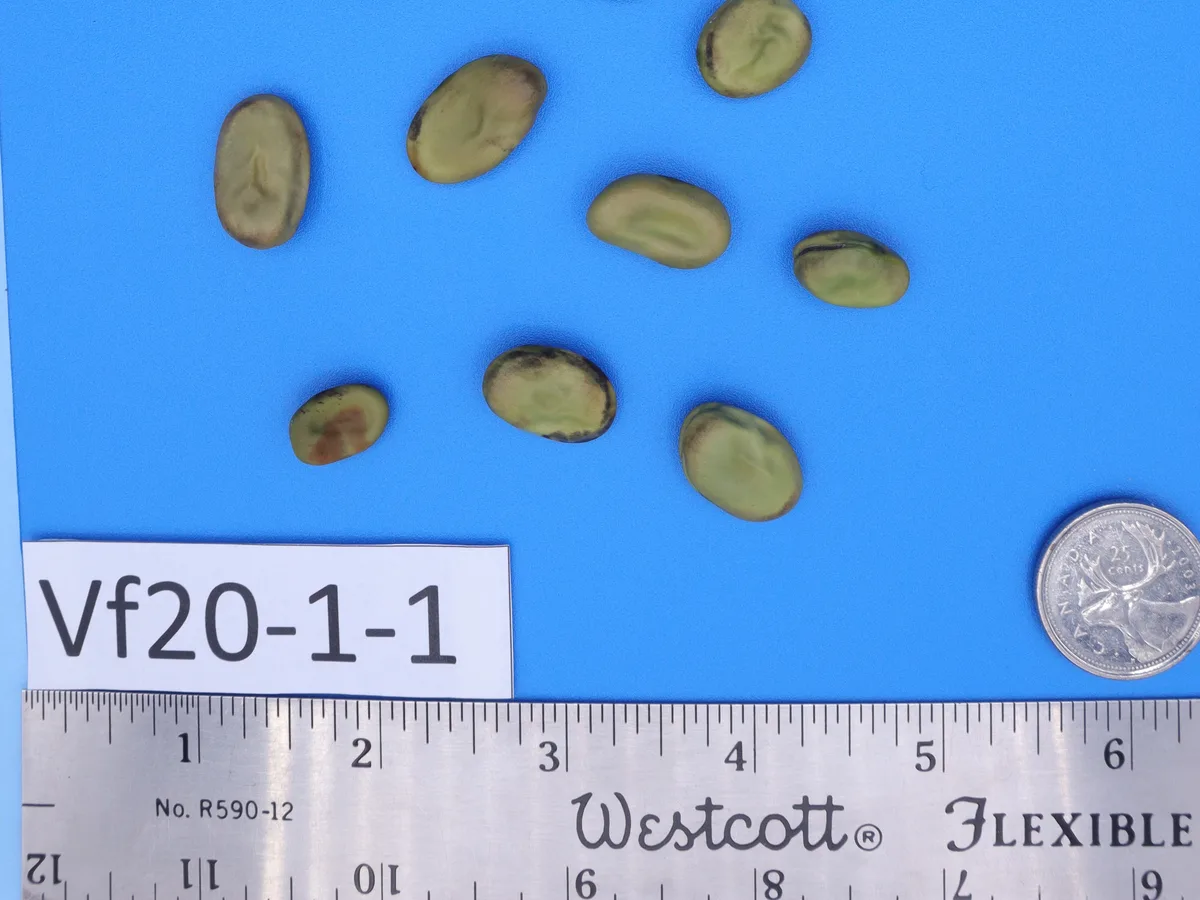
In today's version of the app (4.8.3), the route is the same and takes two drags. On photo Vf100-1-2, one of the three taken from farther away, two 1-inch readings marked by hand on the ruler gave 578.4 and 587.1 pixels, and the app applied the mean: 43.59 µm per pixel. The automatic reading from the 1/16 ticks had given 43.47 µm per pixel. Hand and math are 0.3% apart.
That was the rule we brought to the bench at the 13 November training: a ruler next to every photo, and the scale taken from it, never from the DPI the file declares.
Where it matched
In 11 of the 16 photos, the mean length came within 2% of the authors'. The mean difference across those 11 was 0.03 mm, and the largest was 1.8%. Width came out 1.4% smaller than theirs, on average.
Where it did not match
The 5 photos off the diagonal teach more than the 11 on it.
Two lines of dark purple seeds. The shadow of a dark seed on the blue background is almost the same color as its edge. The outline pushed out over a strip of the shadow, and the length came out 6 to 7% greater, the width 13 to 17% greater. In the figure, the light seed has its outline right on the edge; the dark one gets a rim on the side where the shadow falls.
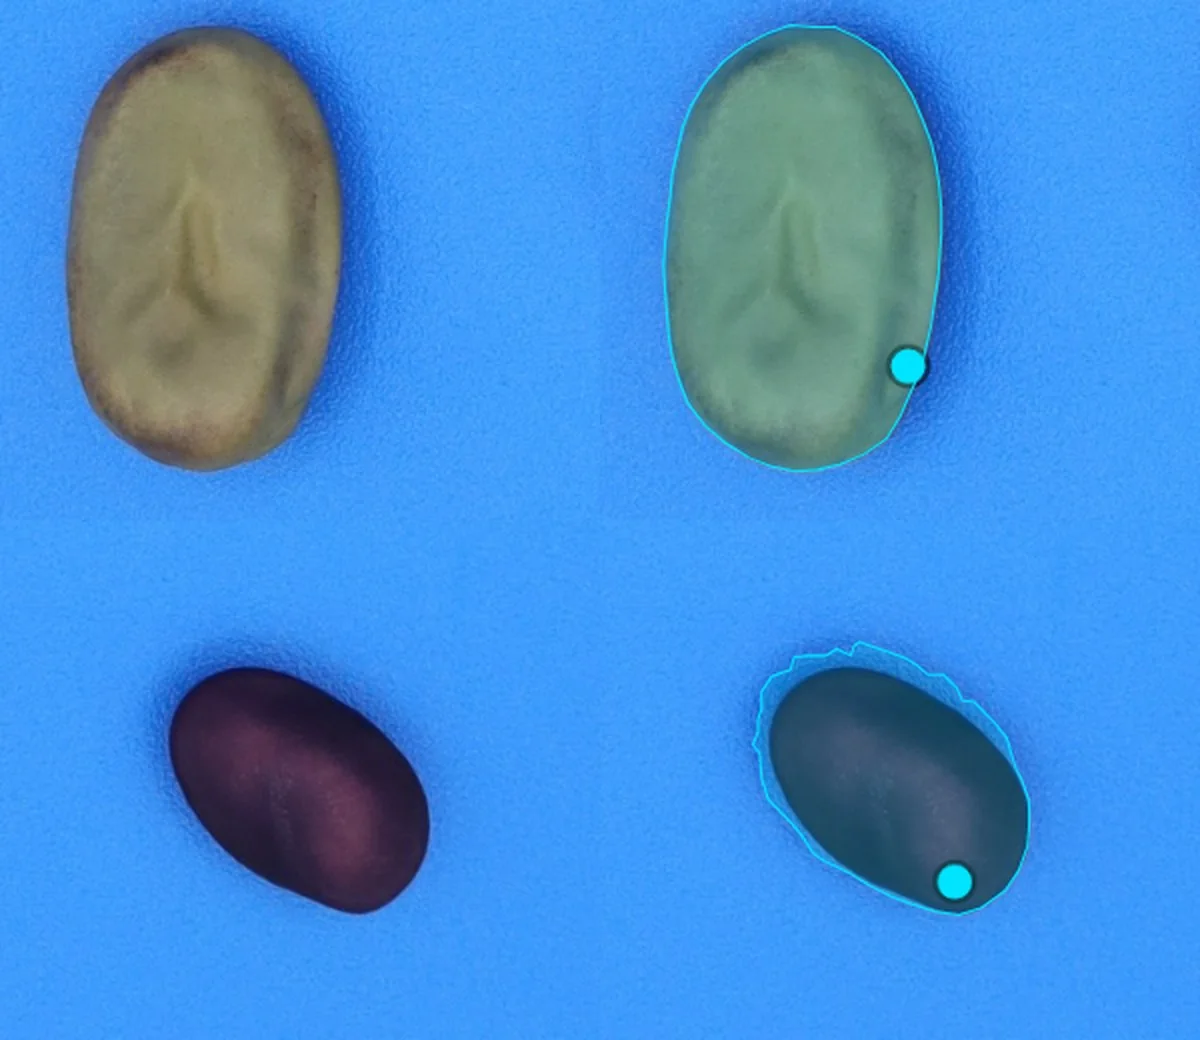
Today's app offers two recipes for this case. Default grows the outline until the color changes, and on a soft shadow it goes along. Sensitive stops earlier and closes tight on the edge, but leaves out low-contrast seeds. On the scanned soybean from the app's example, Default proposed 23 outlines and Sensitive 19, with a mean area 2.4% smaller. The missing ones go in with a click: the machine proposes, the person checks.
Three photos taken from farther away. In them the ruler gives 584 pixels per inch, versus about 626 in the others, and the length came out 5 to 7% greater than the authors'. The first suspect was our own scale, so we measured the Canadian 25-cent coin in the photo itself, which is 23.88 mm. With our scale, it measured 23.3 mm in these three photos and between 23.9 and 24.1 mm in the others. If our scale were inflating the measurements, the coin would come out larger, and it came out smaller. The ruler and the coin agree with each other, so the difference in those photos remains an open question for the authors.
What about other tools?
Comparing against one tool does not tell whether a difference comes from SeedCounter or from the photo. So we repeated the faba beans with two widely used open tools, PlantCV (Gehan et al., 2017) and pliman (Olivoto, 2022): the same image, the same ruler scale, and each tool's settings chosen on three photos kept out of the test.
In the 20 lines where all three found every seed in the photo, they measure almost the same. Length comes out 1.6% to 2.6% above the authors' analyzer, with SeedCounter in the middle at 2.4%.
The dataset carries a second truth, a caliper, measured on part of the seeds. Against it, all three tools sit 5 to 6% above in length, and the authors' own analyzer sits 4.1% above. The authors' two truths disagree with each other more than the three tools disagree among themselves. It may be the caliper, which squeezes the seed and measures in the direction the person picks, or it may be the scale. These photos cannot tell them apart. The next step we have planned measures the same seeds with a caliper and with images, in the same order.
The round also showed the weak spot. With a single setting for 75 photos taken from different distances, SeedCounter's automatic detection missed many of the smaller seeds. The open tools found more, but also counted the ruler, coin and color card as seeds. Either way, the fix is the bench one: draw the seed region and check what was left out before measuring.
Takeaways
- With a plain background, a light seed and the ruler from the photo itself, SeedCounter matches the authors' analysis to within 2%.
- A dark seed on a medium-contrast background is the case where the shadow gets into the outline. The right light helps (see the post Light decides the outline), and recognizing the shadow in the image itself is now on the app's to-do list.
- One scale per photo, taken from the ruler in that photo, avoids the error you get when the camera moves farther away between one photo and the next. The math is in The DPI declares, the ruler measures.
To repeat it on your bench
- Put a ruler, or an object of known size, at the same height as the seeds, in every photo. The setup is in Set up your bench.
- In the app, calibrate from the ruler in the photo itself, under Calibrate scale, Reference object, and save two or three readings. Step by step in the manual.
- Draw the seed region so the ruler, label and coin stay out of the count.
- Run detection and check the outlines. With dark seeds, compare Default and Sensitive before measuring.
- Export the spreadsheet with one row per seed and check it against a measurement that did not come from the image. A few seeds on a caliper already show which side you are on.
Data: Ortega Polo R., Larkan N. (2026). Faba Bean Seed Image Dataset. Agriculture and Agri-Food Canada. Zenodo, doi:10.5281/zenodo.18226381, CC BY 4.0. Per-seed measurements at doi:10.5281/zenodo.18226257. The 16 photos, the scale of each one and the 160 SeedCounter measurements are in fava-16-fotos.csv. Tools compared: Gehan M. A. et al. (2017). PlantCV v2: image analysis software for high-throughput plant phenotyping. PeerJ 5:e4088, doi:10.7717/peerj.4088. Olivoto T. (2022). Lights, camera, pliman! An R package for plant image analysis. Methods in Ecology and Evolution 13(4):789–798, doi:10.1111/2041-210X.13803.