

Theory · Image and measurement
How a photo becomes millimeters.
An image of seeds is a grid of colored pixels. To get a length in millimeters out of it, four things happen in order: the ruler gives the size of the pixel, a threshold separates the seed from the background, the outline closes each seed, and the measurement comes from the outline.
Understand · visual
1 · Scale
A pixel only gets a size when the ruler says so
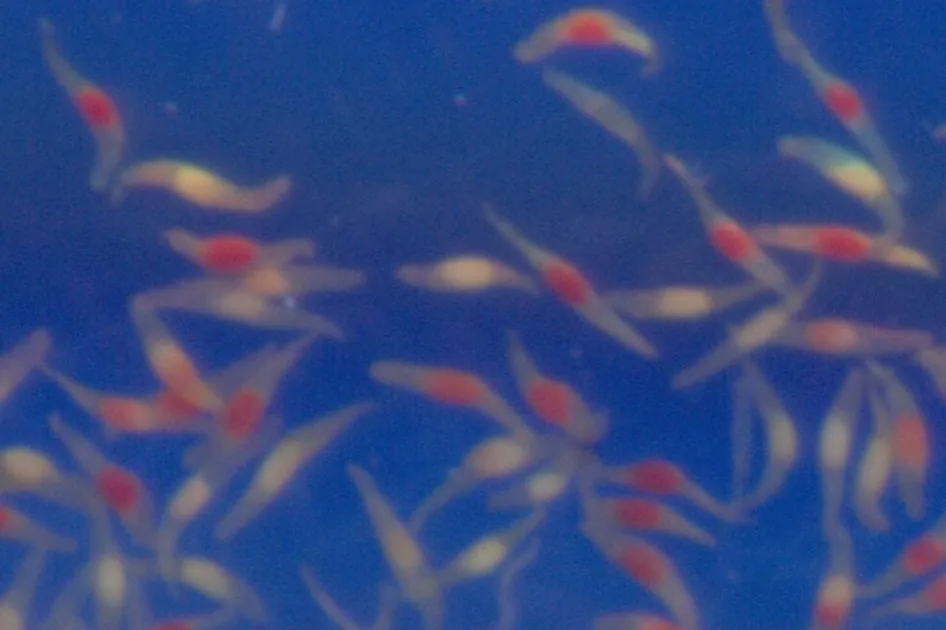
A pixel is a position on the grid. How many micrometers it covers depends on the camera distance, the lens and any crop made afterwards. A ruler photographed in the same plane as the seeds answers the question with one division: if 10 mm of the ruler span 400 pixels, each pixel corresponds to 10 mm ÷ 400 = 25 µm, that is, 40 px per millimeter.
This number, the scale \(s\), multiplies every length measured in pixels. The area is multiplied by \(s^2\). That is why a 1% error in the scale becomes 1% in length and 2% in area, in every seed in the image at once.
The DPI stored in the file is a declaration, not a measurement. On a flatbed scanner, the reported value was 3,600 dpi, and the ruler scanned in the image itself measured close to 4,750: measurements made with the declared value would come out 32% larger. The ruler calculation, with the uncertainty of each click, is in From pixel to millimeter.

1 · 360 × 360 px window
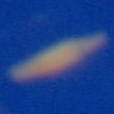
2 · the seed, 114 × 114 px

3 · the tip, 24 × 24 px
Instrument · how much a pixel weighs
…pixel size
…length × width in pixels
…pixels in the seed
…of them on the edge
…±1 px in length
…±1 px in area
seed pixeledge pixeltrue outline
…
The seed is an ellipse with the chosen length and ratio, and a pixel counts as seed when its center falls inside. One pixel more or less at the edge changes the length by \(1/L\) and the area by about \(1/L + 1/W\), with \(L\) and \(W\) in pixels: the derivation is in From pixel to millimeter.
2 · Seed and background
A threshold decides what is seed
Each pixel holds a color. To separate the seed from the background, the computation chooses a color axis along which the two are well apart and a threshold on that axis. Here the paper is blue and the seeds are yellowish or red, so the blue-yellow axis of the color, b* of the CIELAB color space, separates them well. Otsu's method chooses the threshold that leaves the two populations of pixels as far apart as possible [1]. Everything above it becomes seed.
1 · the image

2 · above the threshold
3 · outline and length
The middle of the histogram is made of edge pixels, half seed and half paper. Moving the threshold one way or the other moves the entire edge of every seed, and it is this shift that matters in the instrument of the previous section. How the threshold is chosen, and what happens when the histogram has no valley, are in The threshold.
In SeedCounter, one of the methods is the click wave. You click on a seed, and a front grows from the click through pixels of similar color until it meets the color change at the edge. The threshold stops being one number for the whole image and is instead decided seed by seed, from the point the person chose. The math of the front is in The wave.
Before any threshold, the light has already decided part of the outline. A dark shadow touching the seed can pass the threshold and become seed, and a white reflection can open a hole in it. The math of the shadow is in the post Light decides the outline.
3 · Outline
The outline is a staircase of pixels
The threshold mask is a set of pixels. The outline is the boundary of that set: a sequence of edge pixels, each a neighbor of the next, that goes around the seed. In panel 3 of Figure 2, the orange pixels are that sequence, and the blue line is the edge it tries to represent.
Measuring the length of the staircase has a bias that can be calculated. Counting each straight step as 1 pixel and each diagonal step as √2, the sum exceeds the true perimeter by 5.5% on average over all directions: the factor is \(8(\sqrt{2}-1)/\pi = 1{,}0548\) [2]. In 1,904 rice grains from a published dataset, the measured ratio was 1.054052, within 0.07% of the calculation. The derivation is in The digital perimeter.
The outline that SeedCounter proposes becomes a polygon that the person checks and can correct point by point. Simplifying has a cost: the 48-sided outline overestimates circularity in seeds with low solidity, by 9.9% at the median. It has been measured, and the correction is the next step. The shape measures that come from the outline are in the Shape track.
4 · Measurement
The numbers come from the outline
The area is the count of pixels inside the outline, times the area of one pixel. Length and width are Feret diameters: the larger is the greatest distance between two points of the seed, and the smaller is the smallest opening of a caliper that turns around it. The ratio between the two, the circularity and the solidity are combinations of these measures.
The table lists the four labeled seeds of Figure 3. Without a ruler in the crop, it stays in pixels, and that is why the ruler comes first. With the scale \(s\) in millimeters per pixel, length and width are multiplied by \(s\) and the area by \(s^2\).
Choosing a scanner or a camera changes the resolution and the route to the scale. A scanner at 1,200 dpi gives 47 px/mm, and ruler and seeds sit on the same glass. A camera 44 cm above the plate gives 40 px/mm over the whole plate, and the ruler has to be at the height of the seeds. The comparison is in the animation Scanner or camera.
| Seed | Area (px) | Length, max. Feret (px) | Width, min. Feret (px) | C/L |
|---|---|---|---|---|
| 1 | 1.805 | 86,3 | 31,5 | 2,74 |
| 2 | 2.427 | 104,5 | 33,0 | 3,17 |
| 3 | 1.533 | 75,8 | 34,8 | 2,18 |
| 4 | 2.222 | 105,9 | 29,7 | 3,56 |
Go deeper
The math of each step
Each page below takes one step of this track and does the full math, with formulas, data and references.
On the blog
Further reading
Five readings
- Otsu N. (1979). A threshold selection method from gray-level histograms. IEEE Transactions on Systems, Man, and Cybernetics 9(1), 62–66. doi:10.1109/TSMC.1979.4310076
- Kulpa Z. (1977). Area and perimeter measurement of blobs in discrete binary pictures. Computer Graphics and Image Processing 6(5), 434–451. doi:10.1016/S0146-664X(77)80021-X
- Joint Committee for Guides in Metrology (2008). JCGM 100:2008. Evaluation of measurement data: guide to the expression of uncertainty in measurement (GUM). doi:10.59161/JCGM100-2008E
- Tanabata T., Shibaya T., Hori K., Ebana K., Yano M. (2012). SmartGrain: high-throughput phenotyping software for measuring seed shape through image analysis. Plant Physiology 160(4), 1871–1880. doi:10.1104/pp.112.205120
- Whan A. P., Smith A. B., Cavanagh C. R., Ral J.-P. F., Shaw L. M., Howitt C. A., Bischof L. (2014). GrainScan: a low cost, fast method for grain size and colour measurements. Plant Methods 10, 23. doi:10.1186/1746-4811-10-23
Data
Figures 1 to 4 and Table 1: "Sementes de Orquídeas" dataset v8, Roboflow Universe (universe.roboflow.com/sementes-de-orqudea/sementes-de-orquideas), CC BY 4.0 license. Outlines in Figure 1 drawn from the dataset labels; threshold, mask, outlines and measurements in Figures 2 to 4 computed for this page. No millimeter scale.
Put a ruler in your image.
In SeedCounter, you mark the ruler, click on the seeds and check each outline. Measurements come out in millimeters.